Trading Newsletter – 10/4/2020
Thomas’ Synopsis
Major News
- President Trump has contracted COVID-19 so all eyes will be on him for the next 48 to 72 hours monitoring his health. Markets do not like powerful leaders, especially someone like Trump who’s pro free markets, becoming ill or incapacitated
- Joe Biden has a commanding lead on Trump in the Presidential Election (according to multiple polls). Even the GOP came out and said that they are “writing off a Trump victory for the White House” and “will focus on the senatorial races”.
- The election is in less than 30 days
- Stimulus Talks are stalling. Trump, from Walter Reed Hospital, called on both sides to come together to make a deal. Expect more news and information of the potential deal in the coming days
Upcoming Economic Events

Powered by Investing.com’s Economic Calendar
This week will be relatively quiet in terms of economic data and events. Jobless Claims on Thursday is the only thing I think that could have a material impact on the market. The forecast is 823K but I believe we will see a significantly lower number of claims as the economy starts to churn again.
ATM’s Market Overview
SPY / S&P 500 Futures (2-hour timeframe)
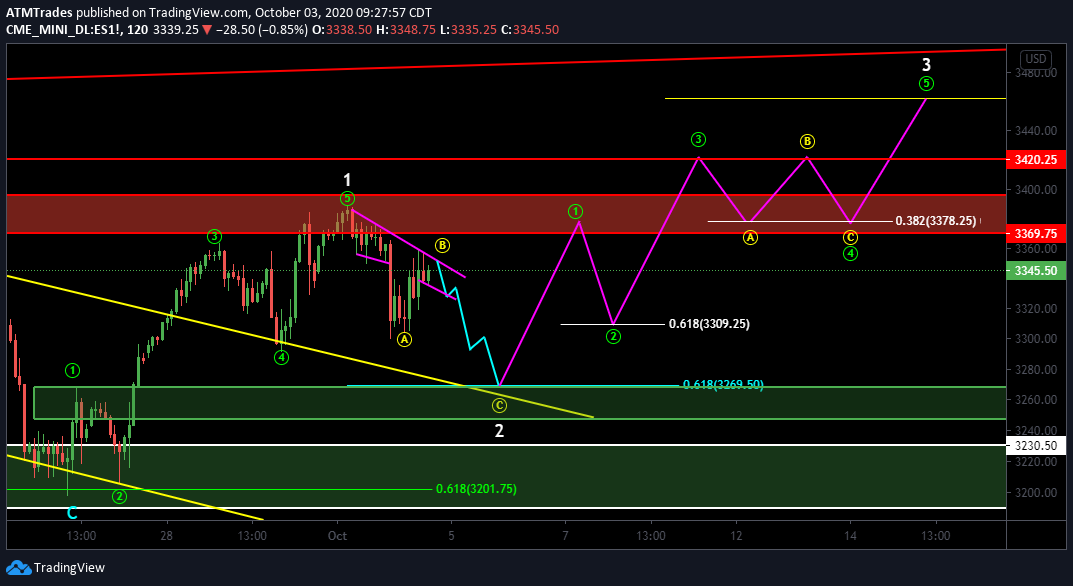
ES/SPY completed five Micro Waves up to the $338 price range last week to finish Minor Wave 1. From here I expect the gap on $SPY to be filled down to the $326-$327 price range. This is where the hourly demand level is which coincides with the 61.8% retrace finishing off Minor Wave 2. From here, we could see a strong reversal from this level to continue higher for Minor Wave 3.
- Resistances to watch for this week are $337, $340, and $342
QQQ (1-hour timeframe)
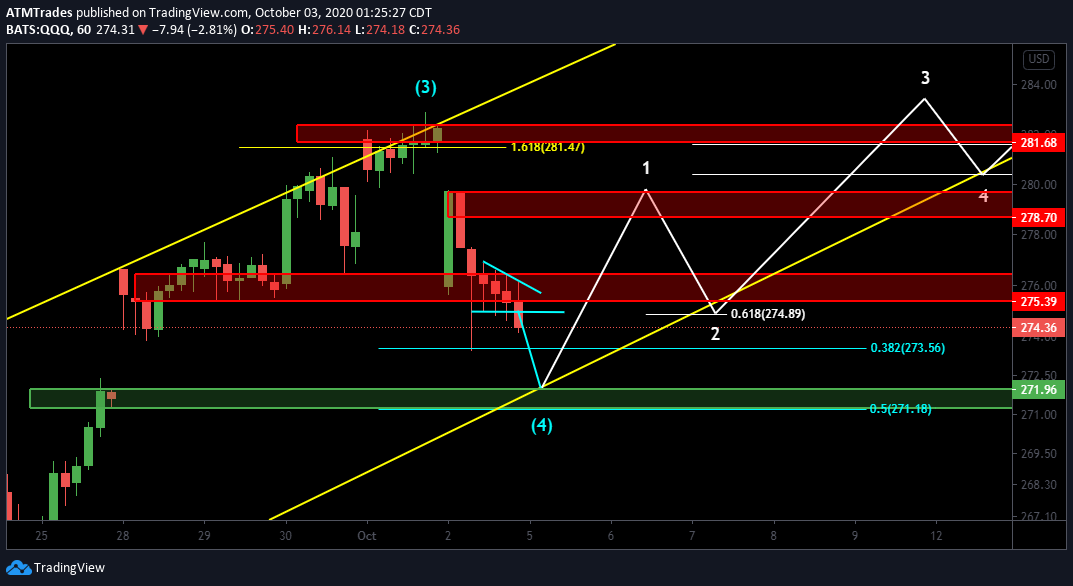
The Q’s sold off towards the end of the week much like $SPY. The selling pressure should continue until the gap is filled downwards to the $271-$272 hourly demand zone. We should see the bulls step back in at this price level to drive prices higher. After we touch this level, I expect us to see a bullish reversal in both $QQQ and $SPY.
- Resistances to watch for this week on the Q’s are $275, $278, and $281
NFLX (2-hour timeframe)
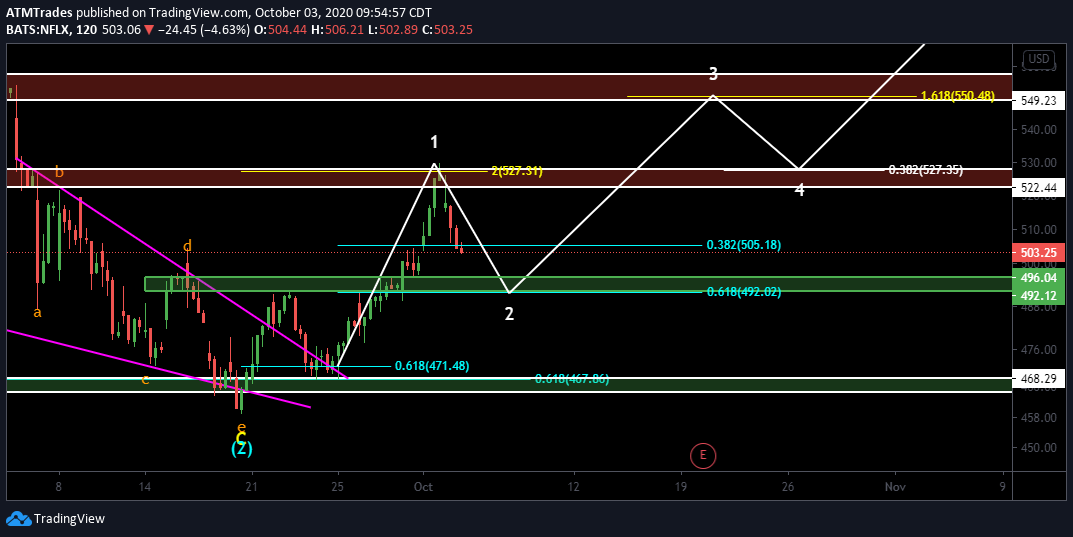
Last week Netflix completed its long ABC flat correction by breaking out of the falling wedge on leg C. On a larger scale, $NFLX is now in Cycle Wave 5 and Intermediate wave 3, which is the strongest impulse wave on the intermediate scale. Minor Wave 1 completed at $527 and it’s now is in a Minor Wave 2 correction which should continue until the $492-$496 demand level is met (coinciding with the 61.8% fib retrace and the Daily 21 EMA). There is a possibility the bulls defend the $500 level, so this is an important spot to keep in mind.
Once this is the range is met I will be looking to go long $NFLX as I expect an explosive move higher on this golden wave (Third of a Third) towards the 550 supply zone (sellers). This long trade idea should confirm over the 510 level. The invalidation level for this trade idea is a daily close below $490 (if it breaks below the trade is no longer valid).
- Resistances to watch for this week on $NFLX are $510, $522-$526, and $540
ZM (2-hour timeframe)
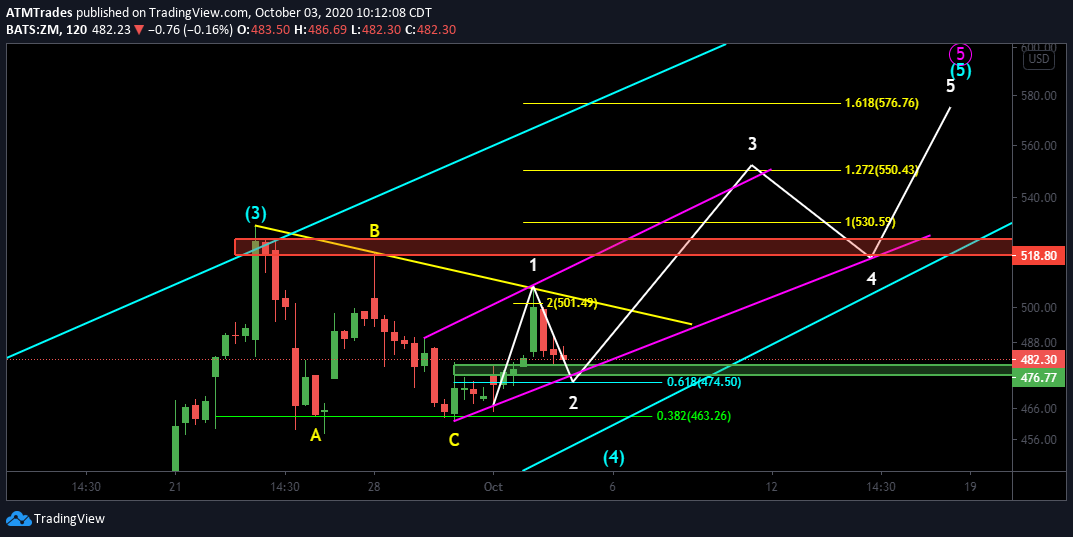
$ZM is currently in wave 5 on the Intermediate scale of the Primary wave 5. Minor wave 1 completed a test of the $501 price range and is now on its way down to finish Minor Wave 2. The hourly demand level resides in the $476-$480 price range with the 61.8% retrace sitting at the $474.50 level (the area I’ll be looking to go long as I expect bulls to step back in to push the price higher). My minor wave 3 target is $550.
This long play is confirmed over $502, opening up the range towards over $518. Once we build support on the $518-$520 supply zone, we can then continue higher for the $550 price target. This play invalidates on a daily close below $470.
- Resistances to watch for this week on $ZM are $502, $518.80, $530, then $550
Airdrake’s Plays of the Week
SQ Cup & Handle (4-hour timeframe)
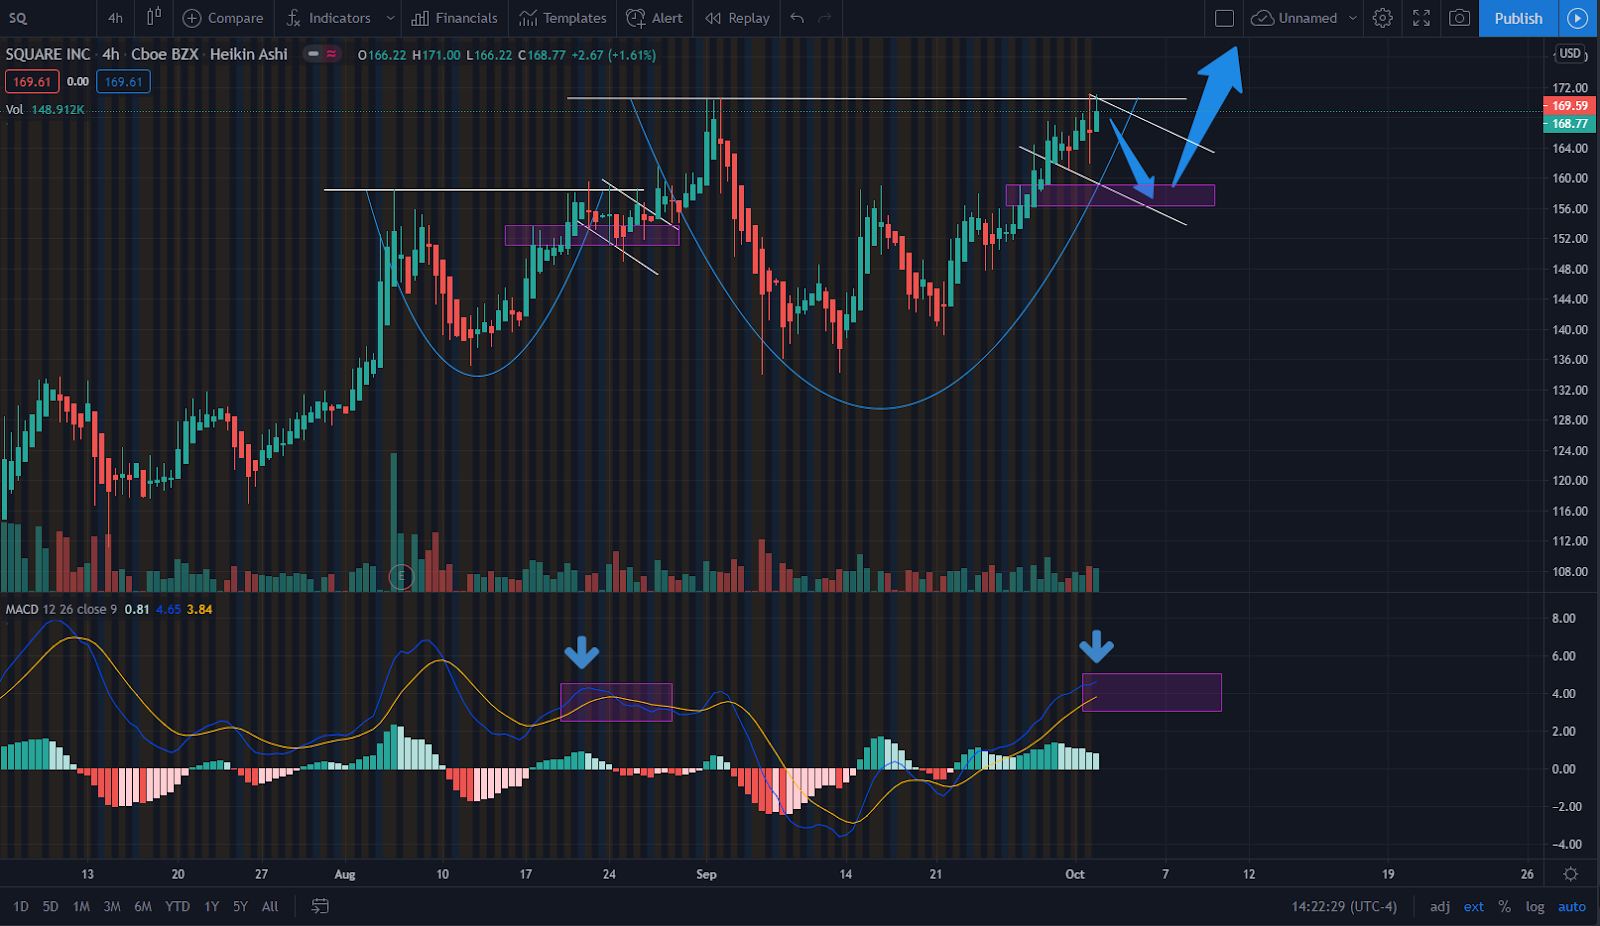
As you see, this is the second time this pattern has formed on $SQ which allows us to see how it played out last time (refer to the first pattern as reference for price action). My target price level is $156.37 to reach the low of the handle (in the top-right purple shaded area). At this level we could see a reversal leading to a potential breakout of the pattern. Always keep in mind playing puts as this will potentially be a quick and rapid movement to the downside unless the market as a whole brings it down further.
DOCU Ascending Triangle (1-hour timeframe)
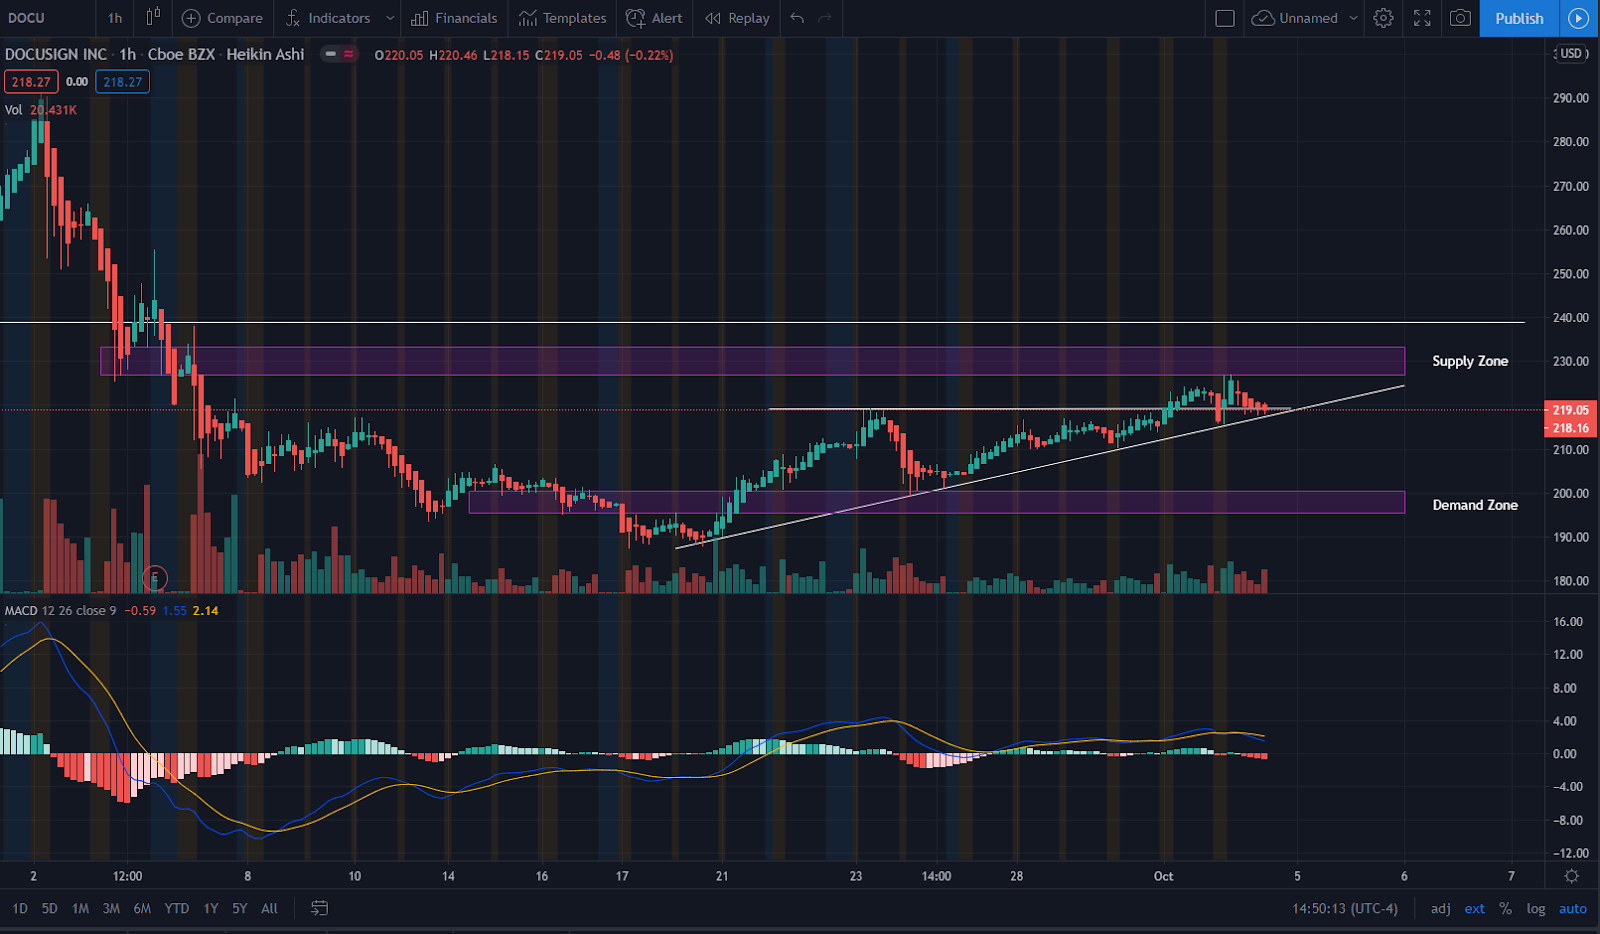
Look for $DOCU to keep pushing as it broke out of its ascending triangle and is holding a trend line. It has rejected its supply zone and currently testing the support line of the previous ascending triangle (it needs to hold this support line to make the next leg higher). Holding a support trendline is key and should be used as a stop loss or exit point. This needs to break above $227 to enter the supply zone again.
- Near-term target $239
Tomikazi’s Segment
Stages of Trading Denial
- Optimism – Start of the cycle – you are disciplined, you have a plan, you are ready to go.
- Excitement – You make your first successful trade utilizing your new disciplined plan.
- Impatience – Also called cockiness. Your plan is working and you want to step it up a notch, so you get bolder with your actions to return rewards faster.
- Misstep – Your first big loss, you were overconfident and held your position to long.
- Revenge – You take a bolder action then the first to recoup your losses to get back on track.
- Acceptance – You accept your huge losses as a lesson and move on.
- Reassurance – You reassure yourself everything will be fine and get back on track with a new plan.
- Repeat steps 1-7
When I started trading, these were the cycles I would continuously go through, and I would never get to where I wanted to go. I had two big things going against me that always held me back.
- Time – I simply don’t have the time to watch a ticker all day (getting in and out when needed to be successful). Half of being a successful trader is timing.
- Emotions – I let emotions get in the way of me being successful, whether taking profits too early because I was excited or letting losses run to long because I couldn’t accept I made a wrong decision.
That’s when it hit me. Why let myself trade when I can make an artificial Intelligence that will trade for me? Thus, began my ambitious journey.
I took all my knowledge I had gained and loaded it into Fortuna (an artificial intelligence (AI) designed to read the market and give me confidence on when to buy and sell). This was the first step in my journey. My next steps were additional AI’s that can talk to each other, read the news, market, and what big money is doing to devise a trading plan. We can then take this plan and automate the trading process, completely removing emotions from the equation.
Fortuna is in beta testing, and I will be using it to reinforce the other parts of what makes a successful trade… It’s something I call the TC Method.
The TC Method
- A great chart setup – The utmost important factor. The chart must be setup for the move you want
- Catalysts/news – There must be a reason for the stock to make a big move.
- Money Flow – There must be money flow “big boys” buying/shorting the stock to make it move.
- Artificial Intelligence (AI) Assurance – Extra confidence when the AI agrees with me
Tomikazi’s Weekly Watchlist
$UBER – Uber Technologies
1-day timeframe

1-hour timeframe

15-minute timeframe
- We have an earnings report coming out on November 9th. $UBER also raised $500 million in funding on October 2nd to help transform logistics on Uber Freight. Both these catalysts will help push the stock. $UBER is also a COVID-19 sensitive stock and could react strongly to vaccine news that is expected this month.
- On October 2nd, UBER had $424 million in Dark Pool (large orders) prints signifying major investors trickling in. Not only that but it also had extremely aggressive options order flow with 91% of options bought being calls. On top of that, there was over $551,000 call options purchased with same-day expirations, signifying very aggressive bullish action.
- Fortuna – https://www.tradingview.com/x/XBp9LvFs/ – On this chart with Fortuna turned on, we can see a reversal and uptrend prediction by Fortuna. Fortuna is designed to predict reversals before they happen by measuring momentum, moving averages, and money flow.
This will be one my top watches for October. Watching for a breakout to the range of $42.44 – $44.84
– The Financial Cloud Team
Disclaimer: Investing involves substantial risk. Neither TFC, the publisher nor any of their respective affiliates make any guarantee or other promise as to any results that may be obtained from using the Newsletter. While past performance may be analyzed in the Newsletter, past performance should not be considered indicative of future performance. No reader should make any investment decision without first consulting his or her own personal financial advisor and conducting his or her own research and due diligence, including carefully reviewing the prospectus and other public filings of the issuer. To the maximum extent permitted by law, the Author, the publisher, and their respective affiliates disclaim any and all liability in the event any information, commentary, analysis, opinions, advice, and/or recommendations in the Reports prove to be inaccurate, incomplete or unreliable, or result in any investment or other losses.