
This indicator is part of our educational suite focused on teaching price structure, momentum, and mean reversion trading strategies for intraday trading. Our team has selected this set of tools and metrics, which define our trading style and serve as the foundation for our teaching, to be included in this indicator. We are displaying each component in a way we believe is helpful to their understanding which also provides a clean, comprehensive look.
This indicator is for Intraday Trading
Our Traders most commonly use this indicator on the 1,3 or 5 minute chart.
Components of this Indicator:
- Multiple VWAP Levels: monthly, weekly, standard (anchored to the right of price)
- Dynamically Anchored VWAP Cloud (trend tool)
- 13 EMA (trend tool)
- Structural Orderblocks
- Multi-Timeframe Fair Value Gap detection
- Key Daily Price Levels (anchored to the right of price)
- Customizable Opening Range (anchored to the right of price)
- 15 minute “Golden Zone” (shows the .5-.618 zone of the previous 15m candle)
- ADR (Average Daily Range)
- A4R (Average 4hr Range)
These tools are used in conjunction with the education we provide to help our users determine their optimal trade plan to utilize their edge.

Specific Functionalities and Uses:
Monthly-VWAP & Weekly-VWAP (M-VWAP/W-VWAP):
VWAP = “Volume Weighted Average Price”
These levels provide probable zones where price may mean revert and risk should be taken off/ put on. We have anchored these to the right-hand side of your chart by default to minimize the noise on your chart.
Average Daily Range (ADR): The Average Daily Range is a technical indicator used to measure the volatility of an asset. It displays how much an instrument can move on average during a given day. The significance is that each market has a unique range that is likely to be covered on any given day.
Average 4hr Range (A4R): The Average 4hr Range is a technical indicator used to measure the volatility of an asset twice in a single session. It displays how much an instrument can move on average during a session and is measured twice in a day. Calculating a smaller volatility range may seem strange at first but can be a huge advantage by analyzing the volatility of the intraday action, giving you average price targets based on more recent market data.
Tip: When used in conjunction with key support and resistance levels, ADR & A4R can be a huge edge to traders to determine where to push/pull risk.
Opening Range: The open often establishes the trend and sentiment for the day, but there is also statistical significance to the open that is overlooked. Statistically, on average, the open is near the high or low of the day and offers plenty of opportunities to build trading strategies. The chart below provides some potential trades that could be taken once the opening range has been established.
Dynamically Anchored VWAP Cloud: Our dynamically anchored VWAP cloud tracks the most recent impulsive move and re-anchors to show you potential bounce points in a trend. We re-anchor at each structural shift to give the most probable targets for buyers/sellers to defend their positions to continue the current trend push.
By utilizing the re-anchoring at each significant structural inflection point, we can establish a much less lagging trend following technique.
We have also included the feature to substitute this cloud for a 34/55 EMA cloud for the traders already familiar with that system.
The chart below provides potential trades that could be taken using the VWAP cloud system.
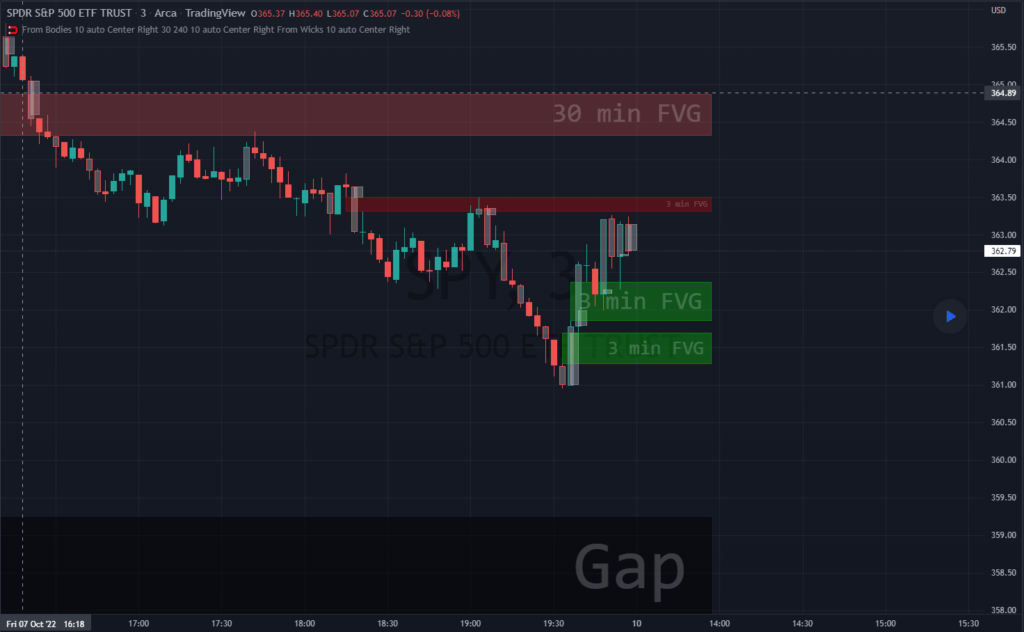
FVGS (Fair Value Gaps/ Imbalances): These areas represent potential buy/sell side liquidity imbalances where price is pushed aggressively, sweeping the orderbook and will likely return to “fix” the structure before continuing. Below is an example of 3 possible trade paths we look for inside these structural imbalances.
Structural Orderblocks:
These areas are based on structural pivots that have been pushed out of with aggression determined by subsequent structural breaks to confirm their validity. Because of this, when price returns to these areas we can anticipate this area to be defended.
The blue boxes track Orderblocks. These highlight instances of past participation which create areas likely to be defended again when retested.
Swing High/Low/Previous:
We use swing high and lows as points of short-term support and resistance, a break of these levels can signify a shift in market sentiment.
-The dashed green line shows the previous structural swing high or low pivot point.
-The solid green lines show the high and low in our current trading structure.
Note: Displaying the previous swing can provide us with context of the current market trend, and will assist us make better decisions.
15 Minute Golden Zone:
Displayed as a gray box, it tracks the .5-.618 of the previous 15m candle and gives us an area where we look for short-term resistance/support on smaller time frame price action. This area can be viewed as an equilibrium of the current range. If the price can hold this area, it can show a likely support area for continuation.
13 EMA:
This is the choice length ema of our traders, they use this ema to confirm (short-term) trend direction and reference it for a common bounce point for re-entries. Our traders consider this as a crucial point to speculate reversals and break of short-term trends.
Note: Typically in a trend we see the price hold to one side of this ema, by looking for this characteristic, it brings confidence to staying in trades.
This indicator is part of our educational suite focused on teaching price structure, momentum, and mean reversion trading strategies. This indicator is recommended to be used with our “Price Action Trading Indicator” or PATI.
Components of this indicator:
- Intraday and Swing Price Structure
- Breaks of Structure Identification
- Change of Character Identification
- Fib-derived Price Targets
- Dynamic ATR-based Trend Cloud
This indicator is intended to be used in conjunction with the education we provide to help our users determine their optimal trade plan to utilize their edge
Intraday (Short-Term) Structure is displayed in gray as HH, HL, LH, LL by default, and the zig-zags can be turned on/off in the settings.
Swing Structure is displayed in yellow as HH, HL, LH, LL by default, and the zig-zags can be turned on/off in the settings.
EQL/EQH show areas where price made an equal low or high.
Dynamic ATR-based Trend Cloud (orange cloud) helps traders stay in profitable trades longer by giving them a visual aid of the current momentum. We have added a confirmation level that dynamically appears when the price breaks over/under the cloud giving validation to the potential trend shift. Failure to break this level tends to result in a rejection and continuation of the current orange cloud trend as you can see in the image above.
Change of Character (ChoCh) shows internal structural breaks where a minor level or supply/demand zone fail, resulting in a potential shift in a short-term trend. Above you can see two common ChoCh setups (head and shoulders/ inverse head and shoulders) that usually result in significant price reversals.
Above is an example of using this indicator on two timeframes to develop short and longer term targets. Previous targets can be used as areas of interest where we can look for price to bounce/reject. Target levels that develop above/below price make great areas to potentially take off some risk/ put risk on.
Short term bullish and bearish signals have been added to signify potential trend exhaustion.
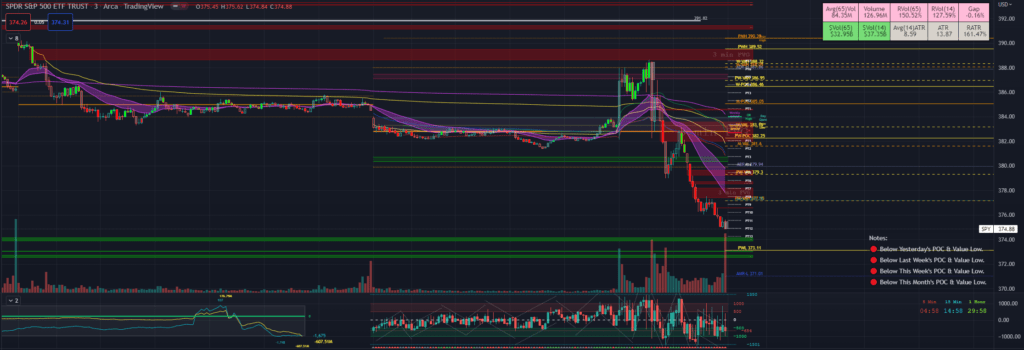
Period Value Zones is designed to help traders understand where current value is being found by splitting the day into 3 key periods based on common reversal times recognized for intraday trading.
By splitting the day into 3 periods, we can more efficiently determine where short-term value lies by using only the data we consider relevant during these periods of time.
Overview
This indicator is recommended for low timeframe trading during the New York RTH Session.
By only trading within this session, we can ensure that volume and volatility remain fairly consistent.
Within each Period, you will find on the chart:
-Value Area Points from Previous period (Value High(VAH)/Value Low(VAL)/Point of Control(POC))
-Volume Weighted Average Price (VWAP) Cloud, based on High and Low values during the period.
-Value Zone based Potential Reversal Zones.
Additional Displays:
-Potential Reversal Detection Signals with Invalidation Levels
-Forward Plotted Key Market times.
Components
Value Area Points
VAH/VAL/POC are important volume profile points which display where the market has previously held value.
We use these specific levels as support and resistance to confirm direction by monitoring interactions between price and these important levels.
The VAH and VAL lines change colors based on price’s interaction with them to confirm whether that level should be regarded as support or resistance.
VWAP Cloud
VWAP is a common metric used to determine the strength of a trend, and provides a point to look for re-bid & re-offer.
When price breaks out of our Fixed Value zone, VWAP helps us determine further direction.
Also included is VWAP deviation bands, for traders who would prefer to view the standard deviation away from this cloud as well.
Value Reversal Zones
These Zones are calculated based on extensions of the Period Value Zone.
While in a balanced market, these zones have been shown to provide potential reversal opportunities.
Potential Reversal Signals
These signals are based on an advanced method for confirming a higher-low or lower-high to reasonably create a signal that is not very laggy but also rooted in sound logic.
While helpful, These are NOT buy or sell signals, and you should always use further analysis to decide the next steps to take.
When a signal appears, an associated invalidation level is also displayed, if this level is crossed the associated signal is no longer considered relevant.
Key Market Times
These are important times within the day that normally produce volatility caused by daily market catalysts.
Each key time is forward plotted 1 hour before it occurs to provide a clear heads up for potential opportunity.
– Opening Fuel: Known for having an increase in Volume after the formation of the 15min Opening Range.
– 1st Reversal: Common Area for seeing initial large positioning effecting the market, often causing reversals.
– Initial Balance Close: End of the first hour, a common positioning tool for futures traders.
– 2nd Reversal: Positioning is typically reactionary to IB Close, alongside Euro Traders Exiting Positions.
– Euro Close: Close of Europe Session, a common positioning tool for futures traders.
– Lunch: Usually Low Volume, traders are often out to lunch.
– Lunch End: Volume tends to re-enter, as traders come back from lunch.
– 1st Reversal: New Hour, common area to see large position re-enter the market.
– Bonds Close: Bonds markets close, Equities reacting to close of the bond market.
– 1st MOC: Initial Market on Close orders are places, market reaction is normally expected off of MOC positioning.
– MOC Close: As MOC orders are reported, volatility is likely found within the market.
Methodology
This indicator can be used with the same principles as trading balanced volume profiles.
- Rule 1: Unless the price breaks and holds Value High or Value Low, we should expect buyers and sellers to maintain the current balance.
- Rule 2: If we break and push away from the Period Value High, we should treat that level as supportive on retest unless we look back below and sellers defend on retest.
- Rule 3: If we break and push away from the Period Value Low, we should treat that level as resistance on retest unless we look back above and buyers defend on retest.
- Rule 4: If we recover Value Low, and it becomes supportive, we look for our Period POC and Period Value High as our targets above.
- Rule 5: If we fail to hold Period Value High, and it becomes resistance, we look for our Period POC and Period Value Low as targets below.
Balance in the context of this indicator is considered as the area between Period Value High and Period Value Low
Acceptance outside of balance in the context of this indicator is considered as Period Value Low or High, becoming supportive or resistance.
For examples: https://www.tradingview.com/script/4UIJG8zn-Period-Value-Zones/