Trading Newsletter – 10/31/2020
Quote of the Week
“The only limit to my realization of tomorrow is the doubt that I hold fast today.”
– Andy Andrews
With some of the worst days seen in the market since June, volatility is surging again ahead of Tuesday’s United States presidential election. Markets aren’t quite sure what to expect. In fact, neither do I or anyone I know knows. It appears Joe Biden has slim lead in the media polls, but some political experts have come out and stated that this “could be 2016 all over again”. The main reason behind their rationale are closeted-Trump supporters: a term used to identify voters who align with President Trump but do not openly, and publicly, express it.
It’s no secret why the market had a terrible week: 1) no stimulus agreement and 2) the ever-increasing chance of a contested election. A few weeks ago, I wrote that the 2020 presidential election would more-than-likely end in a contested election, no matter the won. Each candidate believes he has a legitimate reason to suspect interference from the other’s party. While I don’t like to dabble into politics in our trading newsletter, I do want to encourage everyone to vote, only after they have done extensive research into all candidates (including third parties).
It’s safe to assume that all eyes will be glued to the television (YouTube if you’re under the age of 30) on Tuesday night awaiting the results of the election. What may not be safe to assume is what markets might do the following morning.
One of my friends, GeeNeee, sent me an informative tweet regarding the official and lengthy process that will ensue following Tuesday. He states:
“While we stop voting by November 3rd, vote counting will continue until December 5th. The decisive votes from the electoral college are cast on December 14, and the result is certified by Congress on January 5th. It’s a long process, but we’ve been through it before. There is no reason to believe this year is going to be any different.”
Major News
- The 2020 Presidential Election… Not much else needs to be said as I feel our minds are already saturated with 24/7 coverage of both major candidates.
- Earnings season is at full-throttle, and after investors were disappointed with Amazon’s, Twitter’s, and Facebook’s earnings releases, it will be interesting to see how they react to more upcoming releases (see companies below).
- Most notable releases this week: PayPal, AMC, Hilton, Roku, Alibaba, Square, Marriot, and CVS.
*See below for full calendar Presented by Earnings Whispers (check them out here)
Upcoming Economic Events

If you thought the U.S. Presidential Election was the only thing on the calendar for this week, you’re not the only one. With the amount of attention (and rightfully so, I might add) it’s garnered in international markets, the world will frantically wait until a victor is officially declared.
On watch for next week:
- ISM Manufacturing: This is known as a leading indicator as it’s used to “predict” when recessions begin and end. Anything under 50 is seen as recessionary (bearish) while anything over 50 is seen as expansionary (bullish).
- Initial Jobless Claims: This is the amount of people filing for unemployment that are looking for work but cannot find any.
- Federal Open Market Committee (FOMC) Decision: The FOMC has the power to decide the interest rates for the U.S. economy, and recently we’ve seen the lowest interest rates ever. So when your parents and grandparents complain they have nowhere “safe” to invest their extra cash, you can tell them this isn’t the 1980s with 12% interest rates.
Charts, Charts, & More Charts
Color codes are as follows:
Avery (ATM) = Blue
Haseeb (Airdrake) = Green
Tom (Tomikazi) = Red
These charts are intended to help you to become a better trader, so don’t take every trade seen and expect to make money. Do you own due diligence and research before investing and/or trading.
ATM’s Charts
This week I will be focusing on the technology sector (surprising, I know). The main reason is I see tech continuing to show weakness after multiple earnings releases by some of the top technology names (F.A.A.N. — the exception is Google). The fascinating thing is they didn’t only beat expectations; they knocked expectations out of the park, only to sell off seconds later.
So, going forward for the week, my plan is to play the trend and feast on easy setups. The bear side can be like an elevator ride down and can happen fast.
QQQ (daily timeframe)
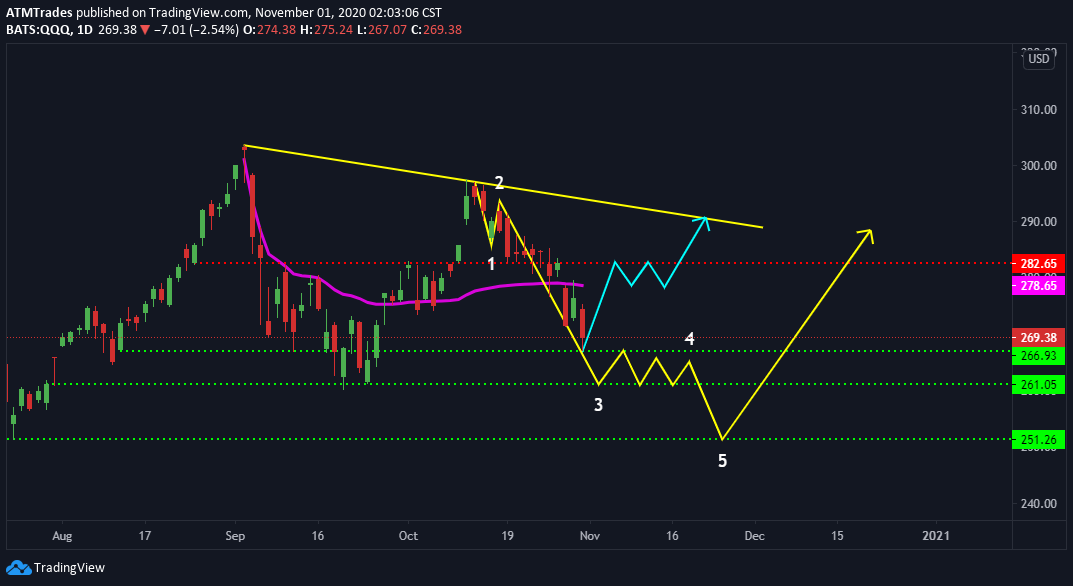
Though I am leaning to the bearish side, I do have plans to play both sides on QQQ. I believe there is a strong possibility that we see a push lower towards the $260 price level where we proceed to consolidate for a period of time while the winner of the election is decided.
The $266-$267 price level is key support for bulls to hold. If they do hold this support, watch for us to push higher towards the $282 price range. The AVWAP (anchored VWAP — shown in purple) will likely be near the $276-$278 price range at which point will be the ‘line in the sand’ that determines whether we continue upwards or head back down.
ROKU (15-minute timeframe)
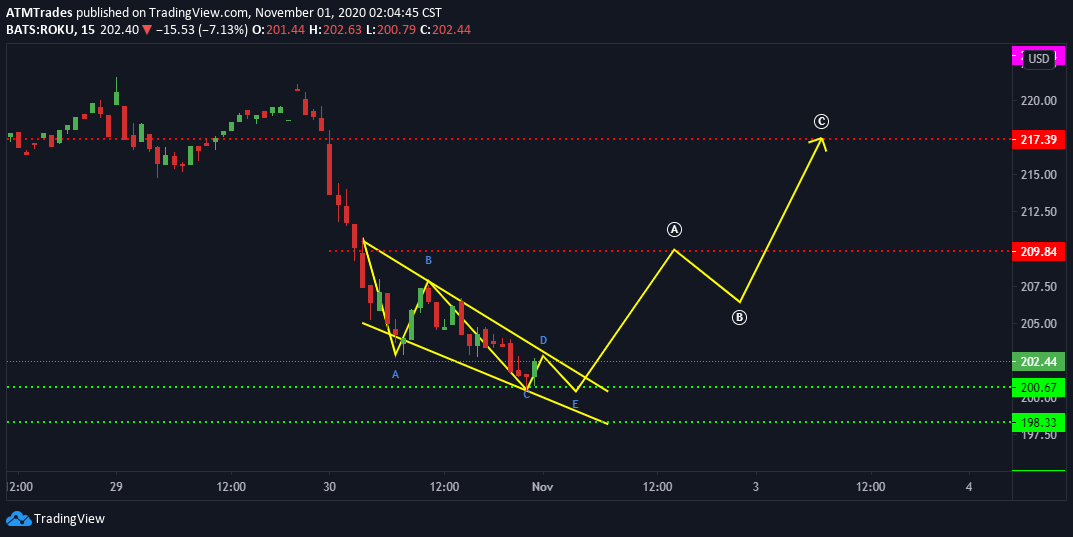
It took a few weeks since I wrote about it in one of our previous newsletters, but ROKU finally came through with a monster short opportunity after breaking the $220 support level. Now that it has fallen significantly from its highs, I do expect the falling wedge to complete near the $198-$200 demand zone and breakout higher to retest the $217-$220 supply level.
Support to watch: $198-$200 zone, $194, $190
Resistance to watch: $210, $212.50, $217.39
This long idea invalidates on a clean break and close below $198. If $198 breaks, watch for a short play towards $194 and then onto $190.
NFLX (4-hour timeframe)
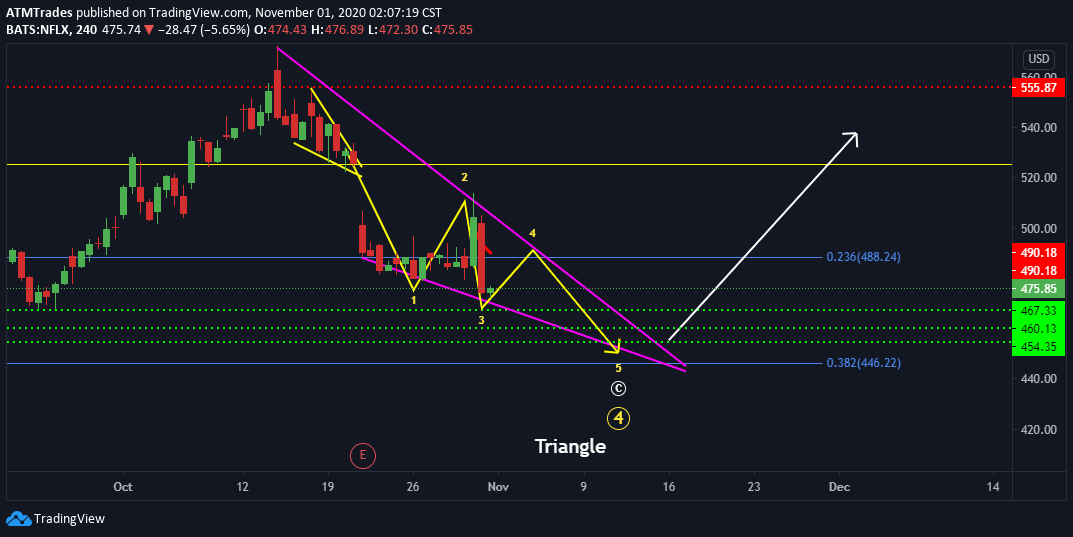
I believe Netflix has a chance to see a solid reversal, off the $467 low, with the potential to head towards the $488-$490 supply zone to complete leg 4 of 5 within this falling wedge.
In my opinion, there is money to be made on both sides, but the short side has more potential for a higher risk/reward ratio.
If you wish to play the long side, watch for the $488-$490 supply zone as potential resistance. Watch for resistance at the $500 level, and, if the momentum remains strong, look for more at the $510 level.
The short side can be played off the rejection of the $488-$490 area, where it will meet the anchored VWAP, supply zone, and 0.236 Fibonacci level. Upon that likely rejection, I will be looking for NFLX to fall towards $467. If this key support breaks, it can confirm further downside to $460, $454, and $446.
Resistance to watch: $488-$490 zone, $500, $510.
Support to watch: $467, $460, $454, $446 (daily 0.382 fib)
This short Idea invalidates on a clean break and or a close above $492.
AAPL (15-minute timeframe)
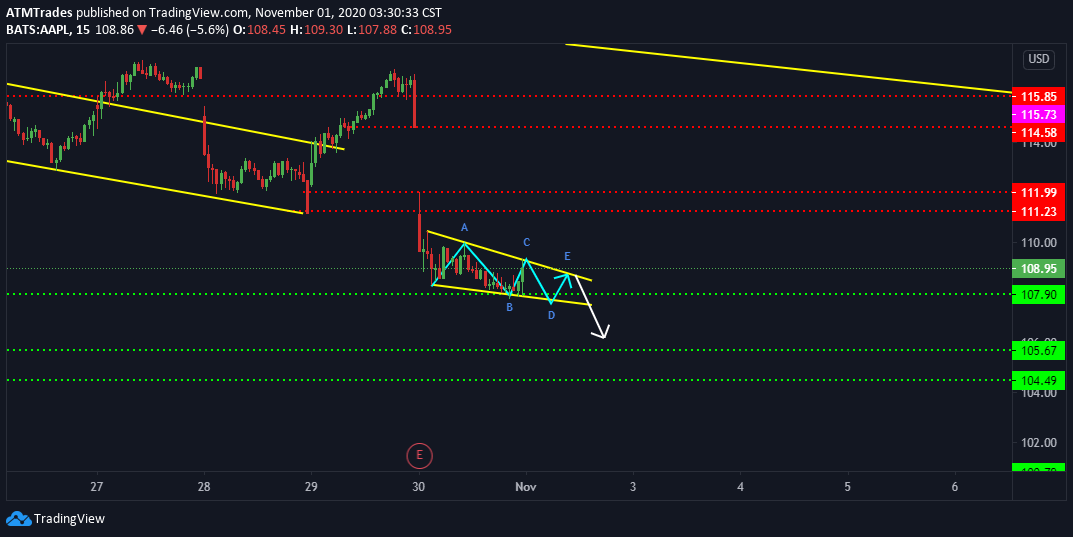
Out of all of the top tech names that fell after releasing earnings last week, AAPL appears to have been hit the hardest. Watch for this bearish momentum to continue if AAPL fails to break through the $110 level (supply zone). If AAPL can hold under $107.90, more downside can happen to the $100 mark.
Resistance to watch: $110, $111-$112 zone, $114-$116 zone.
Support to watch: $107.90, $104.50-$105.50 zone, $100
This short idea invalidates on a clean break and close over the $112 price level.
PINS (1-hour timeframe)
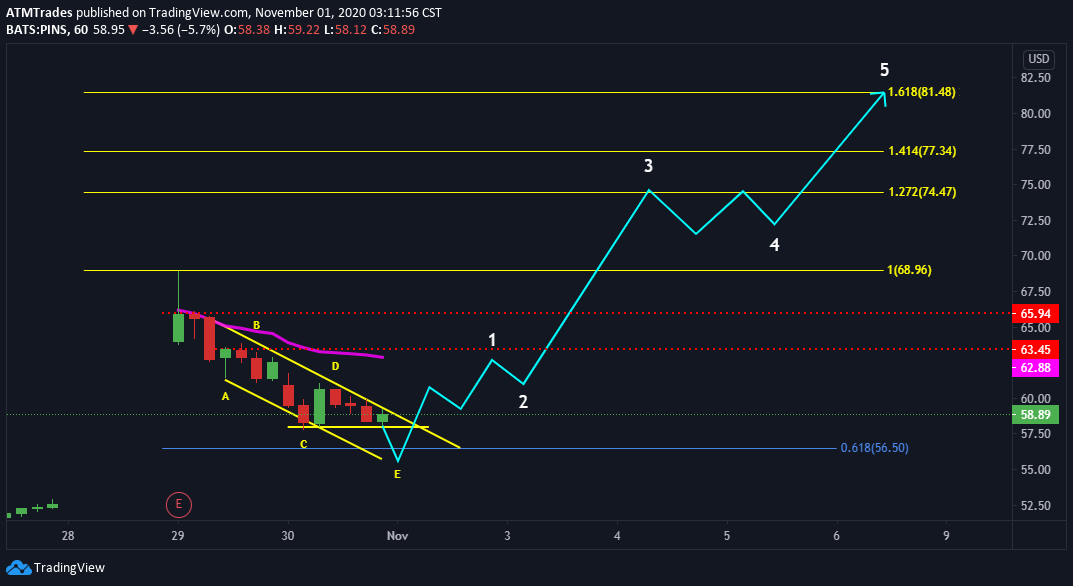
1) the P.E.G. (Power Earnings Gap)
2) Falling wedge – a powerful bullish setup
3) Confluence with the 0.618 or 0.786 fib support.
I believe this has the potential to go parabolic with $56 being the ‘load the boat’ spot. PINS has some resistance to break to confirm my suspicions, but if it breaks and holds above $56, it should be an aggressive breakout. This can be a swing trade or day trade play.
Support to watch: $56-$57 demand zone
Over these zones/levels and PINS should continue higher. Once the momentum starts to get some traction, it won’t take much to break through these resistances.
This long idea invalidates on a close below $52.50.
Airdrake’s Charts
Lottery Play – ZM (1-hour timeframe)
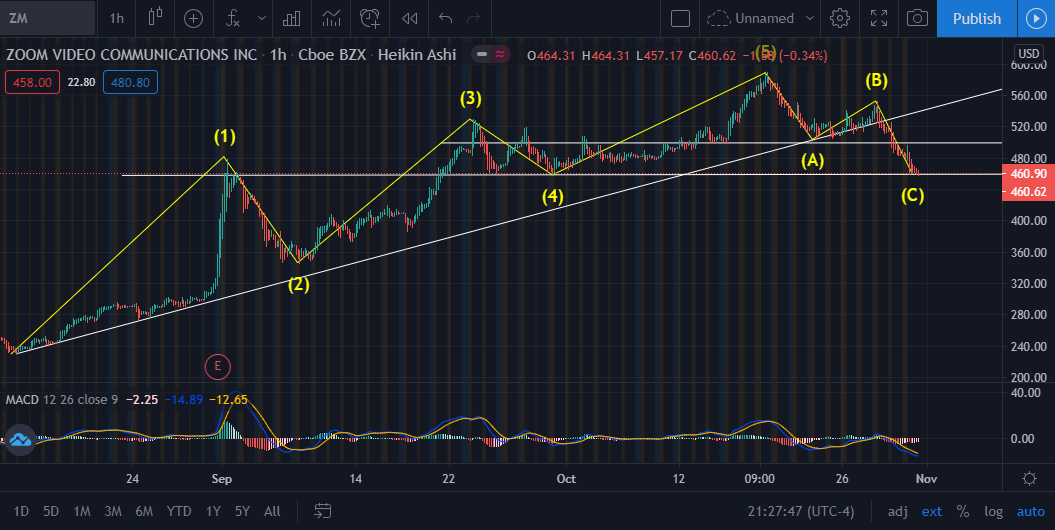
Disclaimer: Please be aware you can potentially lose all of your entry cost into this play seen as it is a ‘lottery play’.
The following play is intended to be low cost and high reward, driven by the following analysis:
ZM – Call Debit Spread
Buy the call at $500
Sell the call at $510
Projected cost of this lotto play as of right now is $165 and max profit is $835 Profits/losses can be taken earlier at any time before expiration with no penalty.
News:
10/15 – Bernstein raised the price target from $228 to $661.
10/15 – Rosenblatt raised the price target from $350 to $450.
10/14 – Operating margin at 25% compared to 20%+ estimate. Gross margin expected at 80% compared to prior 80-82% in Q2.
Analysis: All we have seen since the all time highs on ZM is profit taking. This can be seen by correction waves in the Elliott Wave Theory. ZM continues to thrive during the pandemic and is currently at a key support level (ending wave C). One thing to keep in mind is that ZM can reach a new all-time-high as the coronavirus pandemic once-again threatens governmental shutdowns.
Support to watch: $457, $433, $412
Resistance to watch: $487, $498, $525
FB (1-hour timeframe)
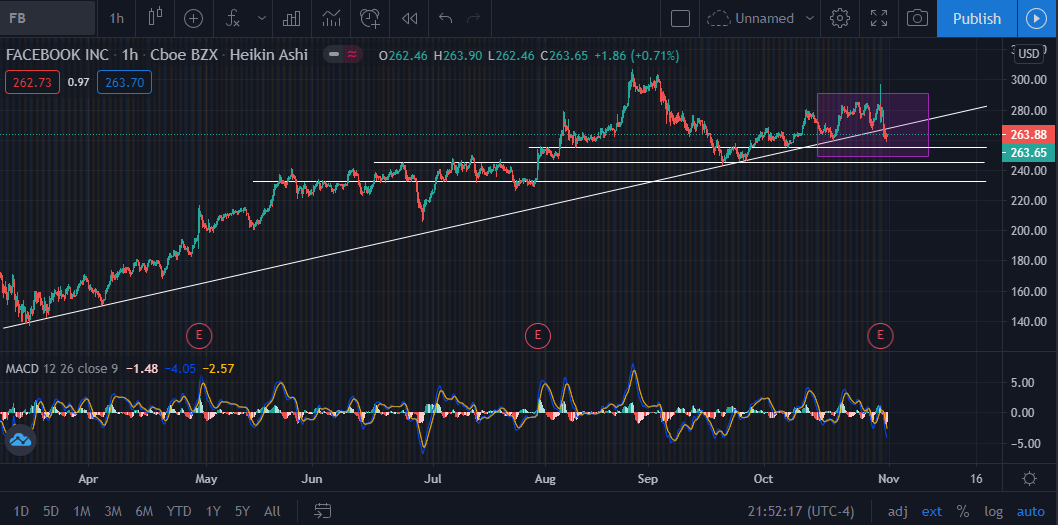
News:
10/28 – Q3 earnings release with a 2% decline in user growth.
Analysis: Tech sector is still getting beat down, so follow the trend. The market will almost always provide setups to trade. If the market continues to bleed, watch the support levels below. Don’t try to time the reversal either; never catch a falling knife.
Support to watch: $255, $245, $232
Resistance to watch: $262, $268, $279
GS (1-hour timeframe)
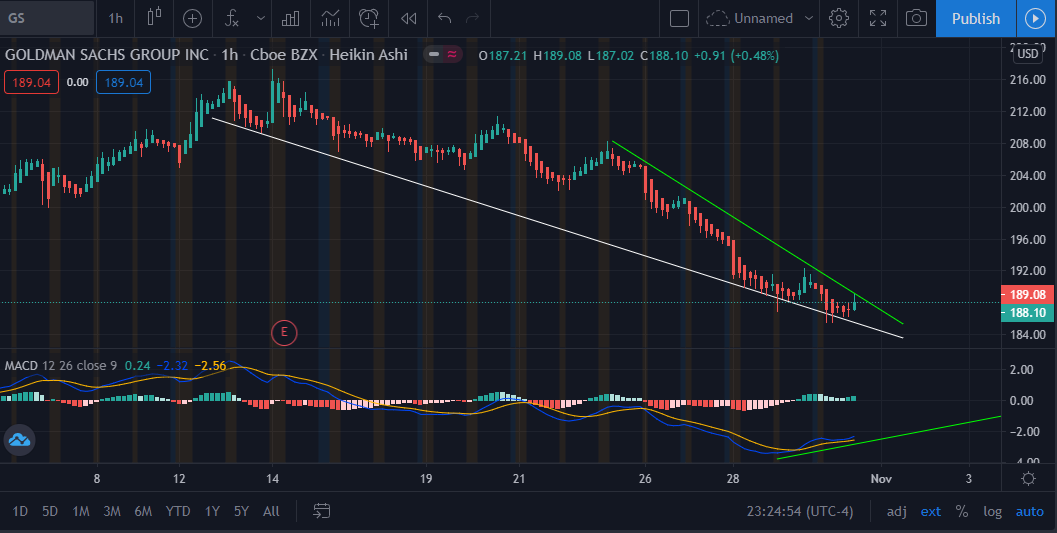
10/27 – Cowen reported it expected big banks’ capital to rise if Biden wins election.
10/27 – Atlantic Equities raises price target from $210 to $230
10/15 – Declared $1.25 dividend
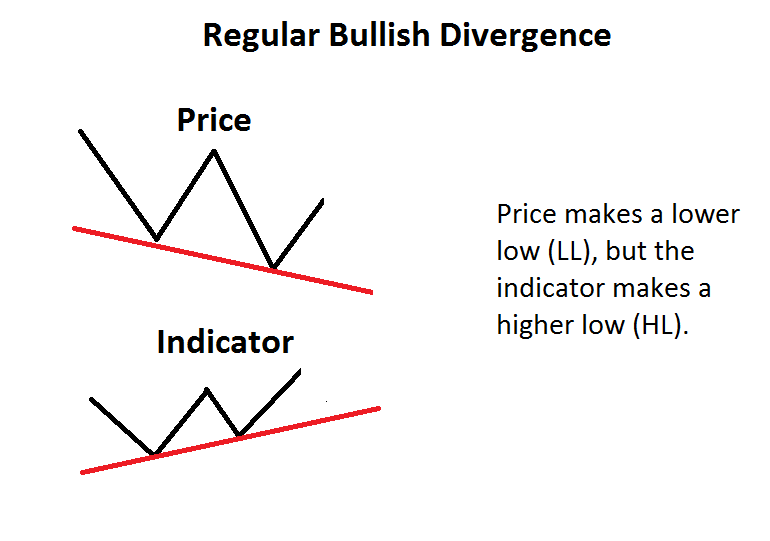
Analysis: GS is portraying a falling wedge like much of the market right now, but what I’m more interested in is the bullish divergence shown above. The downtrend is making lower lows, and the MACD is making higher highs. Keep an eye on the bank sector as it may make an effort to hold up markets as the tech sector continues to show weakness. The green lines outline bullish divergence in the chart above.
VXX (1-hour timeframe)
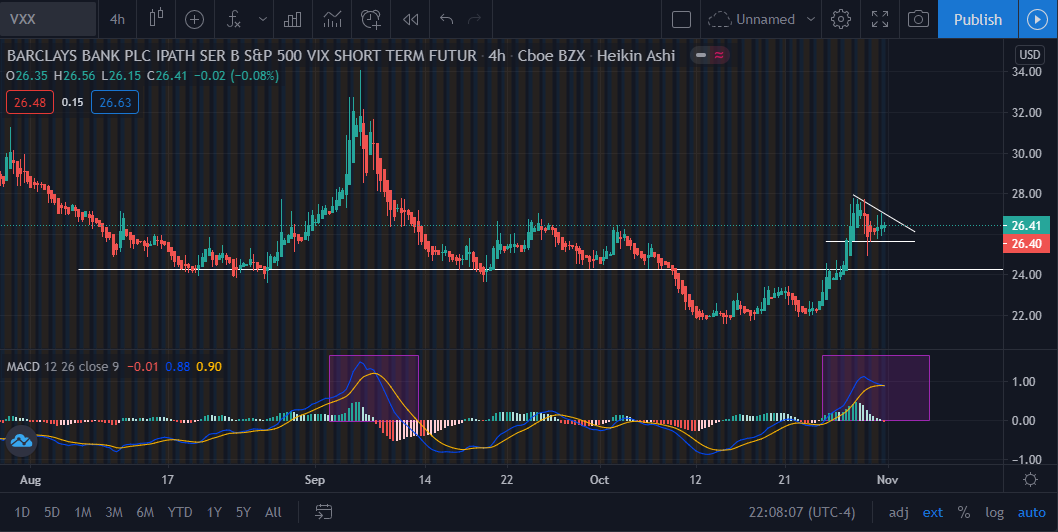
Analysis: Keep an eye on the bull flag forming with the MACD curling downward. This is showing mixed signals going into election week, so either VXX will spike out of its bull flag (causing markets to continue their bleeding) leading the MACD higher, or it fails the bull flag as the markets push higher. VXX is a volatility index and cannot always be traded like large-cap companies, because it’s prone to move on a small piece of news.
Tomikazi’s Charts
Chart Key
Numbered Green Moves – Bullish Wave Projections
Lettered Red Moves – Bearish Waves/Projections
Green Lines – Resistances
Red Lines – Supports
Teal Vertical Lines (zones) – Key decision points, where it can possibly choose if it wants to follow red or green lines.
Purple Vertical Lines – When Earning is Announced
PYPL (15-minute timeframe)

PayPal reports Q3 earnings Monday after market close.
While it would make sense for it to follow the green path towards the $190 mark in a bull market, we need to keep in mind that market sentiment could drag this down to $179 area as well. Keep an eye on the key pivot point levels and zones going into start of Monday’s trading session.
W (15-minute timeframe)
Wayfair reports Q3 earnings Tuesday before market open.
Wayfair has had quite a run this year in our new COVID-19 lifestyle. It has also given back quite a bit of the recent runup and could give up more if sentiment continues to be sour. Again, this will be a “watch the pivot point” play come Monday morning, as any piece of news between now and then could impact the overall market.
Key levels will be the $252 area; it will decide to either run or tank into earnings. The bull case could potentially see Wayfair towards $268, whereas the bear case might see the $235 mark.
QCOM (15-minute timeframe)
Qualcomm reports Q3 earnings Wednesday after market close.
Qualcomm had an incredible run with 5G being officially released this year (which will lead to a massive revenue increase). Like much of the market, QCOM has almost entered correction territory, but it hasn’t suffered as much as some companies this past week.
Key pivot point will be the $124 mark. If QCOM fails to break $124, then $119 is very likely. A break above the $130 level would confirm a major bull run might be beginning.
BABA (15-minute timeframe)
Alibaba reports Q3 earnings Thursday before market open.
BABA has had a favorable year, reaching all-time-highs not too long ago. A key time zone to watch will be late Monday morning; watch to see if can break two key areas of $306 and $308. Failure to break above these price levels could send it into further correction territory towards $290. If it can break above them, then $312-$315 is a possibility.
PTON (15-minute timeframe)
Peloton reports Q3 earnings Thursday after market close.
PTON’s whole week will be determined on how it closes on Monday (red or green). If a green close, PTON might take the green path ($120 area), but if it’s a red close, the red path would be more likely ($115 area).
CVS (15-minute timeframe)
The key point for CVS is whether or not it can break and hold $56.50 as a support. This would signal a bullish reversal going into Friday’s earnings report. A failure to break it before earnings could send CVS back to multiyear lows. As one of my favorite companies to long, I will be watching CVS all week. The 2020 Presidential Election and U.S. Senate Elections could heavily impact CVS as healthcare has been a major debate in recent months. Trump winning would be extremely bullish for CVS and could send this on a multiyear bull run.. With a rather large dividend payout and near multiyear lows, the catalysts this week make this my top stock to watch this week.
Watchlist for the Upcoming Week
PYPL, HUM, W, QCOM, BABA PAPA, RGEN, AZN, SQ, ROKU, PTON, CVS, VIAC, & ZNGA
– The Financial Cloud Team
Disclaimer: Investing involves substantial risk. Neither TFC, the publisher nor any of their respective affiliates make any guarantee or other promise as to any results that may be obtained from using the Newsletter. While past performance may be analyzed in the Newsletter, past performance should not be considered indicative of future performance. No reader should make any investment decision without first consulting his or her own personal financial advisor and conducting his or her own research and due diligence, including carefully reviewing the prospectus and other public filings of the issuer. To the maximum extent permitted by law, the Author, the publisher, and their respective affiliates disclaim any and all liability in the event any information, commentary, analysis, opinions, advice, and/or recommendations in the Reports prove to be inaccurate, incomplete or unreliable, or result in any investment or other losses.