Trading Newsletter – 10/11/2020
Stimulus or no stimulus? That is the question. With the election almost three weeks away, all eyes are on
1) how much stimulus will be granted,
2) when it will be granted, and
3) from whom it will be granted.
President Trump has touted that he will “go around” Congress in issuing additional aid for the U.S. economy, but political experts say that road will be a tricky road to navigate since his campaign falling further behind Joe Biden’s in the polls.
Mitch McConnell, the Senate Majority Leader representing the state of Kentucky, has “written off” a Trump victory on November 3rd and wants to focus on getting Amy Coney Barrett’s nomination through the Senate as fast as possible. Multiple other high-ranking GOP members have written off a Trump victory in November and want to focus on retaining republican control in the Senate.
Major News
- President Trump still has COVID-19 but according to White House doctors is “no longer able to transmit” the virus. Trump’s campaign has already started in-person events again at the White House.
- Stimulus talks are… we’re not exactly sure what they are. While Trump recently offered $1.8 trillion in stimulus, both republicans and democrats seem not interested in the deal.
Upcoming Economic Events

Inflation has always been a major factor in the stock market, but with record amounts of government stimulus, it has been thrust into the forefront of economists minds.
There are two economic indicators that economists heavily focus on: the consumer’s price index (CPI) and the producer’s price index (PPI).
CPI measures the change of inflation (difference in prices between two time periods) on a basket of goods (i.e., food and beverages, housing, medical care, transportation, etc.) while the PPI measures the average change in sales price for an entire domestic market of raw goods and services. The difference in the two are denoted by “consumer” and “producer” in their names which often help tell the story for both companies and customers.
The market has been betting that inflation will start to pickup in the coming months, so be careful going long if CPI and PPI come in lower than expected.
Charts, Charts, & More Charts
All charts have been aggregated into one section for easier viewing. The ticker and timeframe have been color-coded to reference the specific contributor who created the chart analysis.
Color codes are as follows:
ATM = Blue
Airdrake = Green
Tomikazi = Red
These charts are intended to help you to become a better trader, so don’t just take every trade you see and expect to make money. Do you own due diligence and research before investing and trading.
Okay… now to the charts.
SQ (1-day timeframe)
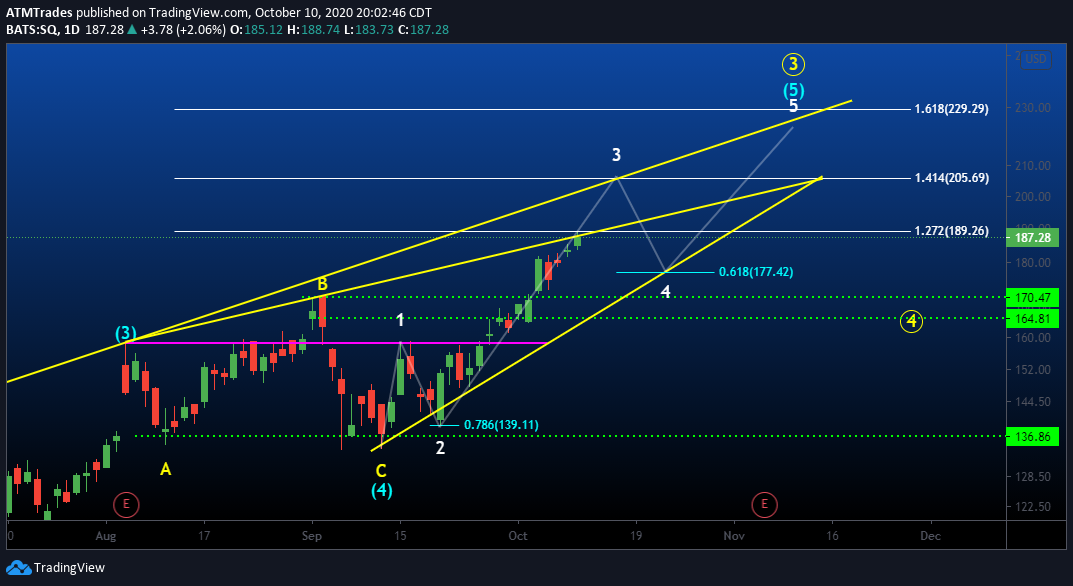
SQ has been running with strength as multiple analyst upgrades and price target revisions came in this past week. I like this setup (long) if over $190 to see if it can confirm future upside through Fibonacci and trend resistances around the $200 level. Ultimately, $205 is the price target for this wave. Look to enter SQ on a dip near the $184-$185 price range or for a strong breakout over $190. This long play invalidates on a close below $180.
AAPL (2-hour timeframe)
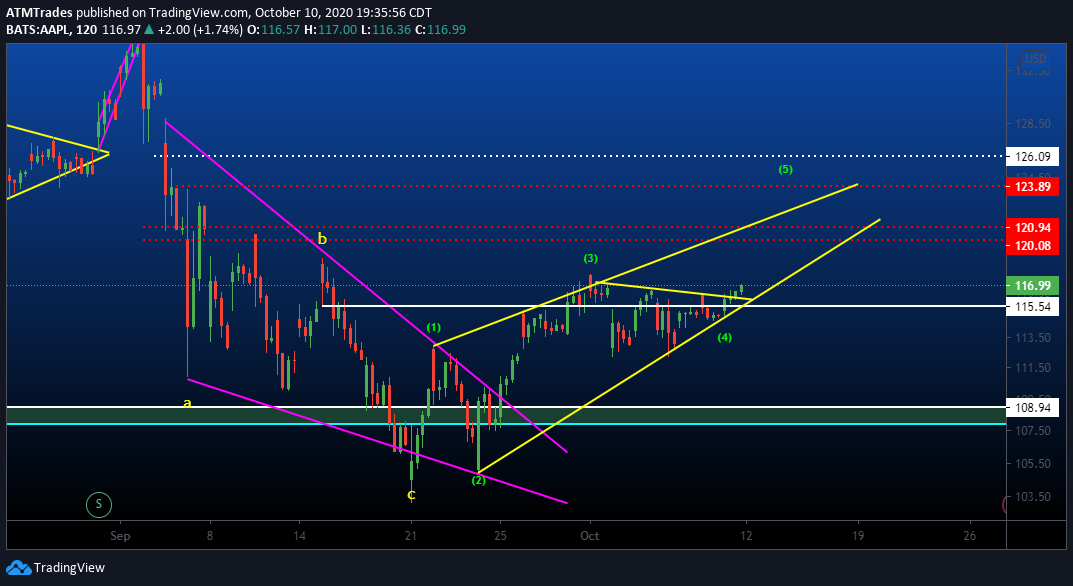
On Tuesday, October 13th, Apple will hold the new iPhone release event. I expect AAPL to run up into the event and possibly continue higher after. Look for a breakout over the $117 level, where it will then push towards the $120 supply level. If the supply holds, there will be further resistance at $123 and $126 targets.
- Resistances to watch for: $117, $120, $123, and $126
MCD (2-hour timeframe)
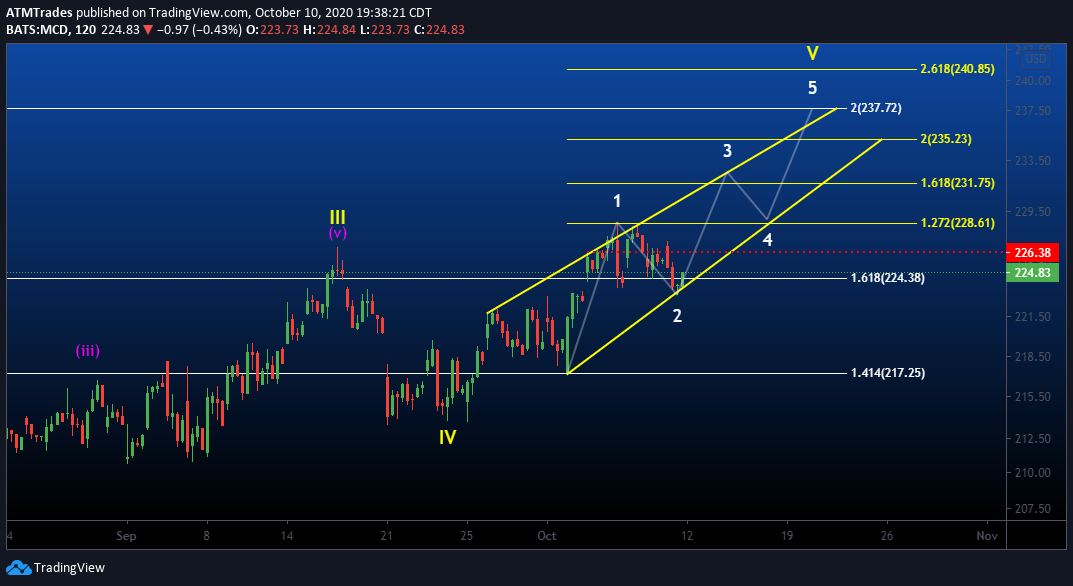
MCD had several raises in price targets last week ranging from $230-$250, yet it still sold off. I believe MCD can run towards the $230 level this week as it should reverse off of the daily trend line and demand support levels. This is a slow mover with cheap premiums, but with momentum it can rise steadily for multiple days
- Resistances to watch for: $226.50, $228.61, and $230
ZM (2-hour timeframe)
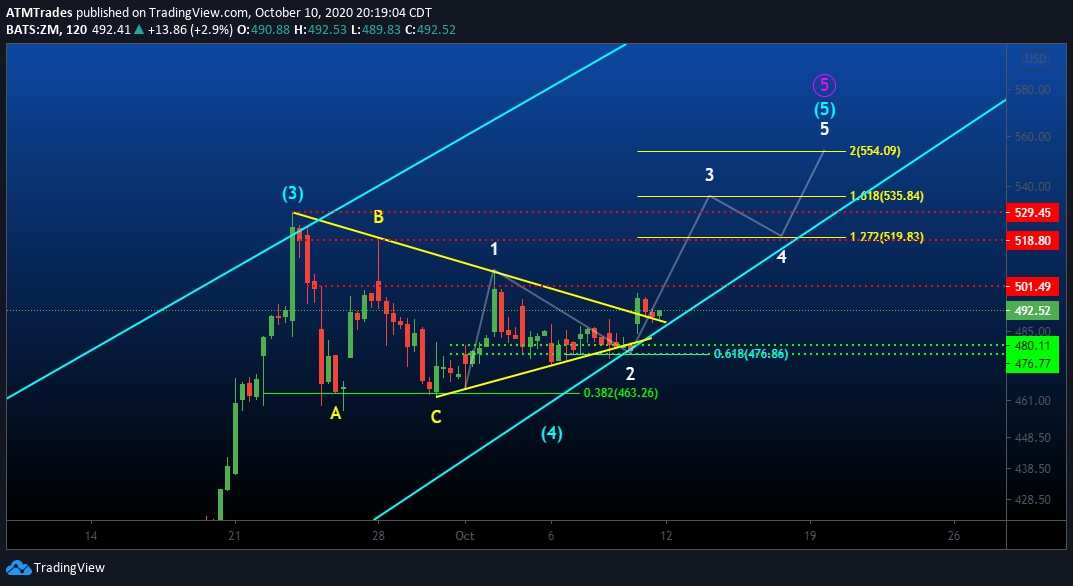
Back at it again with ZM here. This time around we finally have a breakout in the works after it moved sideways all week until friday. Zoom defended the 476-480 hourly demand level perfect and managed to pop above the daily friday before perfectly retesting support before close.
Now what we want to watch for is for ZM to break and hold above 502. Once this breakout confirms it should move rather quickly towards the daily supply (Sellers) at 518 where i expect consolidation near this level. Once we claim 520 a move towards 530 and ultimately 535 can happen next.
- Resistances to watch for $500-$502, $518-$520, $530, $535
FSLY (1-day timeframe)
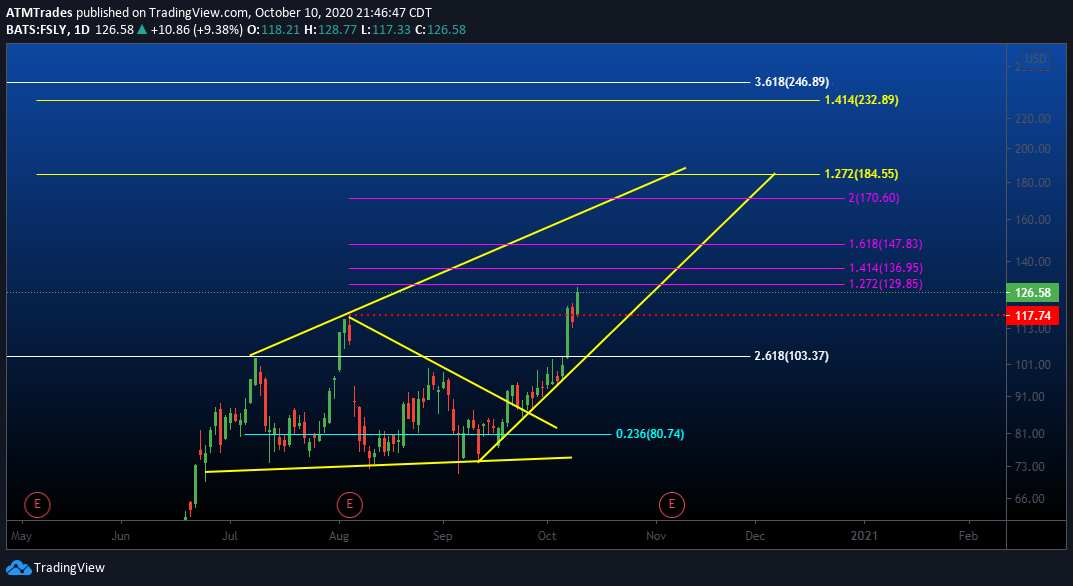
One of my favorite plays this week is continuation on FSLY.
Last week we confirmed a daily breakout over $117. A perfect scenario would be a pull back towards $120 before rising again, but this appears to be a ‘play the breakout’ type move. Over $129 and it could see $136 soon, and, if the parabolic movement continues, watch for a short consolidation near the $136 resistance level before it pushing higher for the $147 price target. This long trade is invalidated on a close below $120.
- Resistances to watch for: $129, $136, $140, $147, and $150
FB (1-hour timeframe)
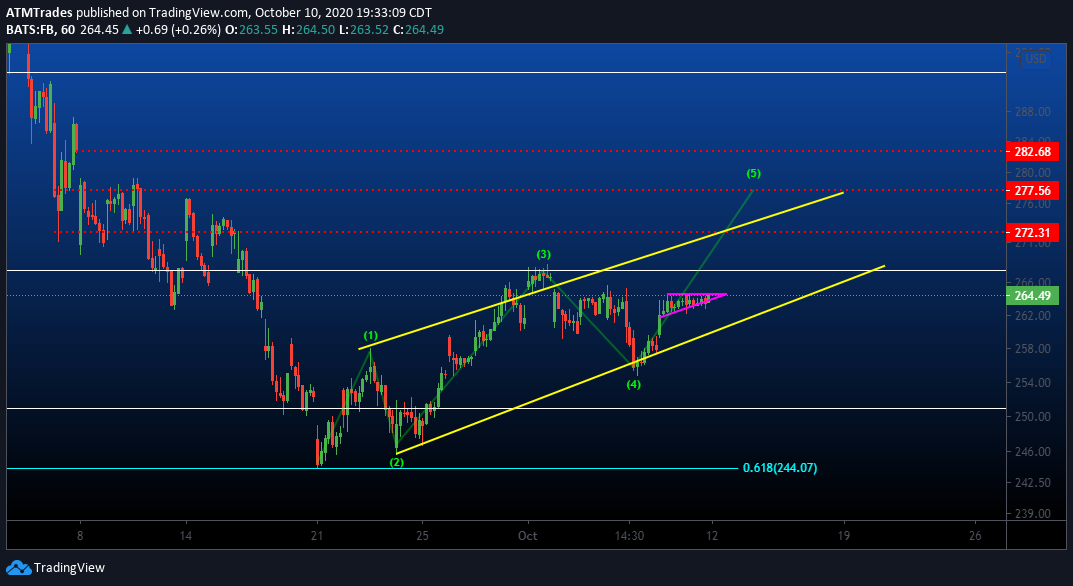
Among the high-profile tech stocks, FB has been oddly quiet as of late. I believe money will rotate into it this week, pushing it higher into the $270’s. We have a nice ascending bull flag itching to breakout. Over $265 and this can push towards the $268 level where I believe the resistance will be minor.
Following a breakout over $268, the first target will be $272 where I expect to see us consolidate before ultimately going for the $277 target. This long trade is invalidated on a close below $262.
- Resistances to watch for: $268, $272, $277, and $282
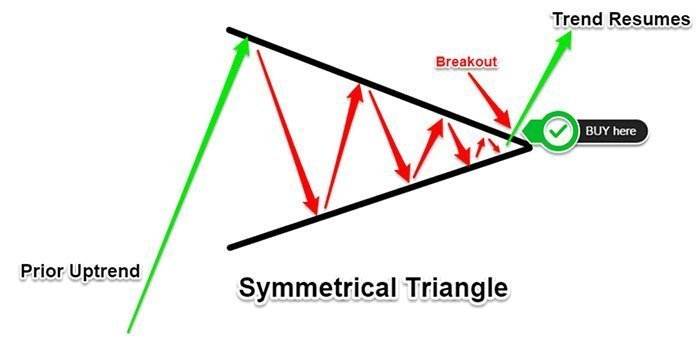
WKHS (1-hour timeframe)
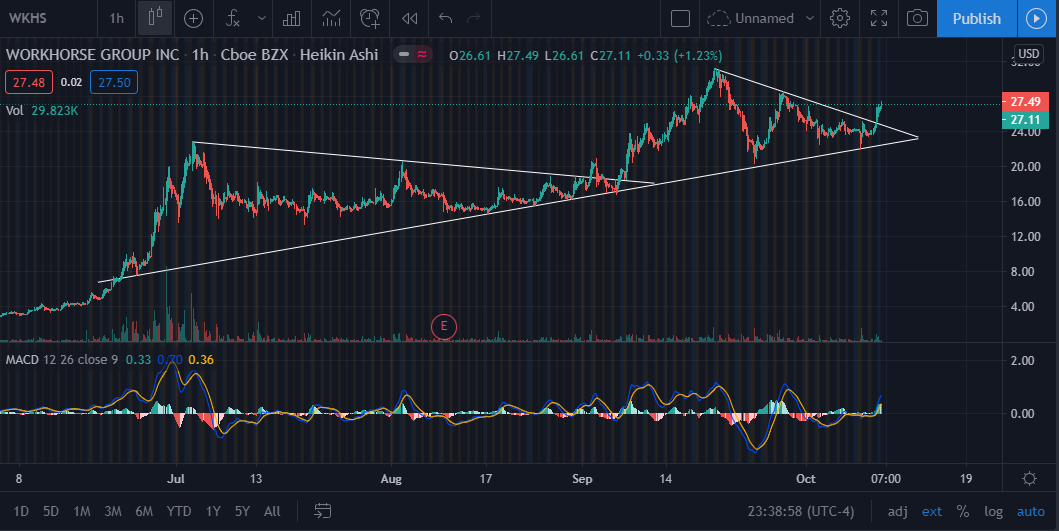
News: Workhorse is the only company in the three teams of bidders offering a fully electric delivery truck. It would appear to be the best aligned to reduce future maintenance costs for the Postal Service and others.
Analysis: It’s already in a breakout of the symmetrical triangle on 1-hour chart. If resistance at $29.87 area breaks, this stock can make new all-time highs soon.
HD (1-hour timeframe)
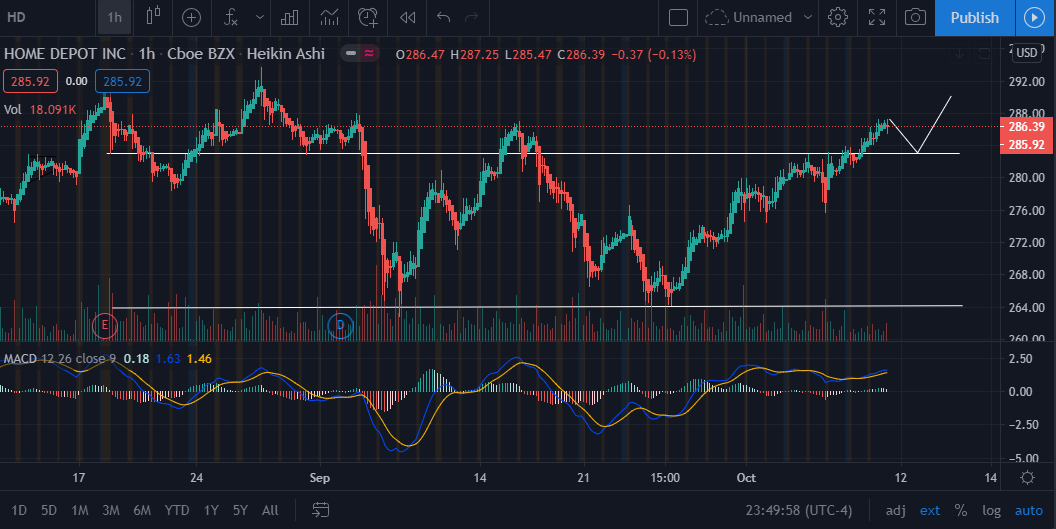
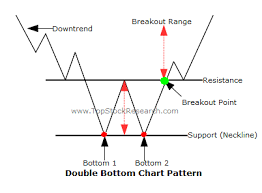
Analysis: There’s a double bottom pattern on the 1-hour chart. Look for pullback to $283.08 area as entry point. The target resistance is around $289.70.
UBER (5-minute timeframe)

UBER review
Last weekend’s TC top pick was UBER, hitting all 4 elements of a good trade. So let’s review how that went. I mentioned it was likely to retest support near $36.57. Which it did October 6th (check the chart here). We can see it held support and then reversed back to the high of the week, putting us on track for Wave 3 and a mid cycle of a five-wave bullish cycle (chart seen above).
In this chart, we can a see few bullish micro-cycles with my prediction for the next week. A potential target will be between $38.70 and $41.00 if we continue in this bullish wave cycle. This theory is reinforced again with aggressive UBER call flow and continued darkpool buying. We also notice an artificial intelligence (Fortuna AI) signaled a possible reversal to the upside at the end of Friday. With more stimulus rumors pouring out Friday and the likelihood of vaccine news this month, UBER remains a strong play and a top watch for the month. We also have news out of California of a referendum in the upcoming election that would help protect UBER and LYFT business models in the state.
IBM (15-minute timeframe)
IBM review
IBM received lots of attention on October 7th, when it announced it would split up into two companies. The new company would focus on cloud computing and artificial intelligence, while the old would focus on IT infrastructure. The breakup would occur sometime next year. This move was met with very bullish sentiment as the stock soared upwards 6% off the news. Let’s analyze the chart by the simple trend lines.
Here we can see a clean gap up above old resistance (green line), which turned into support near the end of Friday. This point also collided with an old support line. It was interesting that at this point the Artificial Intelligence (Fortuna AI) also issued a buy signal reaffirming a reversal opportunity. All of these things point to the chart being primed for a move back up if it can hold the red support line. We also had five major analysts upgrades and thirteen total upgrades after this move, with an average increase in target price of 7.65% over the next 12 months. Most are agreeing that fair-value is somewhere between $140-180.
I believe this will help push IBM towards $132-$138 before issuing their earnings report on 10/21/2020 (click here is a zoomed in version of the low-side prediction).
All we need now, in the equation for a successful trade, is to see if this week’s money supports a move up. IBM has $124,000 in aggressive call flow on Friday, but what I’m more interested in is the fact that IBM had $1.45 billion in darkpool buying this week. Yes that’s BILLION, not million.
All of the pieces for a successful trade are here for IBM:
- The chart is setup for a move
- There is bullish news to move it, and we have Earnings run up
- The Artificial Intelligence agrees it’s primed for a move back up
- The Money is coming in
– The Financial Cloud Team
Disclaimer: Investing involves substantial risk. Neither TFC, the publisher nor any of their respective affiliates make any guarantee or other promise as to any results that may be obtained from using the Newsletter. While past performance may be analyzed in the Newsletter, past performance should not be considered indicative of future performance. No reader should make any investment decision without first consulting his or her own personal financial advisor and conducting his or her own research and due diligence, including carefully reviewing the prospectus and other public filings of the issuer. To the maximum extent permitted by law, the Author, the publisher, and their respective affiliates disclaim any and all liability in the event any information, commentary, analysis, opinions, advice, and/or recommendations in the Reports prove to be inaccurate, incomplete or unreliable, or result in any investment or other losses.