Trading Newsletter – 10/18/2020
With the presidential election drawing closer and closer, both candidates are aggressively trying to widen their voting base by any means available. Social media, town halls, and advertisements are a few ways Donald Trump and Joe Biden are attempting to lure potential voters to the polls.
Normally, during an election year, volatility increases while equities trade in a tight range until a winner has been announced, but the year of 2020 is anything but normal. 2020 has been a whirlwind of emotions that could potentially throw some last minute curveballs our way. With a few different potential outcomes in the election, the most-likely to happen is a contested election. This is one of those rare things that Wall Street and Main Street seem to agree on. A contested election would look something like this:
– states recounting ballots
– claims that mail-in ballots were rigged/not safe
– Supreme Court ruling on the victor
These may seem like dystopian predictions, but almost everyone agrees that this election is going to be a wild ride. No one would be surprised if it came down to a fist-fight between Trump and Biden to decide the winner.
Also, if you wouldn’t mind, we’re conducting research related to the upcoming election and would love it if you took the survey linked below.
Take Our Presidential Election Survey Here!
Now onto the newsletter…
Major News
- Nancy Pelosi has shifted the deadline for fiscal stimulus to this Tuesday, October 20th, in an effort to shorten the deadline for an agreement between the two parties. Her main goal is to have it done before the November 3rd presidential election after President Trump tweeted that his aides would stop working on a deal until after election. Trump stated he believes he can convince the GOP to back a “good” deal, but the democrats are hesitant as the Senate Majority Mitch McConnell has not always seen eye-to-eye with President Trump on stimulus-related talks.
- Earnings season has begun, and, while only a few major companies reported this past week (Citi, BlackRock, Delta Airlines, etc.), a whole new slew of companies will release this week. Notable mentions are Tesla, Netflix, IBM, Proctor & Gamble, Chipotle Mexican Grill, Intel, Verizon, and many more.
*See below for full calendar Presented by Earnings Whispers (check them out here)
Upcoming Economic Events

In terms of economic data release activity, not a lot of data will be released this coming week.
The normal Initial Jobless Claims and Existing Home Sales reports will be released on Thursday providing a in-depth view into how the U.S. economy faired during the month of September.
On watch for next week:
Third quarter (July through September) GDP data will be released next Thursday at 8:30 EST. This is one of the few economic indicators that can have a massive impact on markets across the globe, as GDP tells us how productive society has been over the past three months. The trading day can be determined solely by this piece of information (bullish or bearish), so be careful if we either beat big or miss big.
Always remember: Play the trend
Charts, Charts, & More Charts
All charts have been aggregated into one section for easier viewing. The ticker and timeframe have been color-coded to reference the specific contributor who created the chart analysis.
Color codes are as follows:
ATM = Blue
Airdrake = Green
Tomikazi = Red
These charts are intended to help you to become a better trader, so don’t just take every trade you see and expect to make money. Do you own due diligence and research before investing and trading.
Okay… now to the charts.
Market Outlook | SPY/S&P 500 (4-hour timeframe)
As elections approach, experts are projecting us going up, down, and every way possible… you name it and I’ve seen a prediction on it.
What I’m currently seeing here is a handle beginning to clearly develop, as we just attempted to crack recent ATH’s Monday and were swiftly rejected. A pull back towards $340-$342 is highly likely (completing this corrective count) and where I suggest you prepare for the next bull run. It should push us to new all-time-highs before the election.
Support to watch: $343.25, $342, $340
Resistances to watch for: $347, $349, $352, $353.50, $354.50
The bull case is invalidated on a strong close below $340.
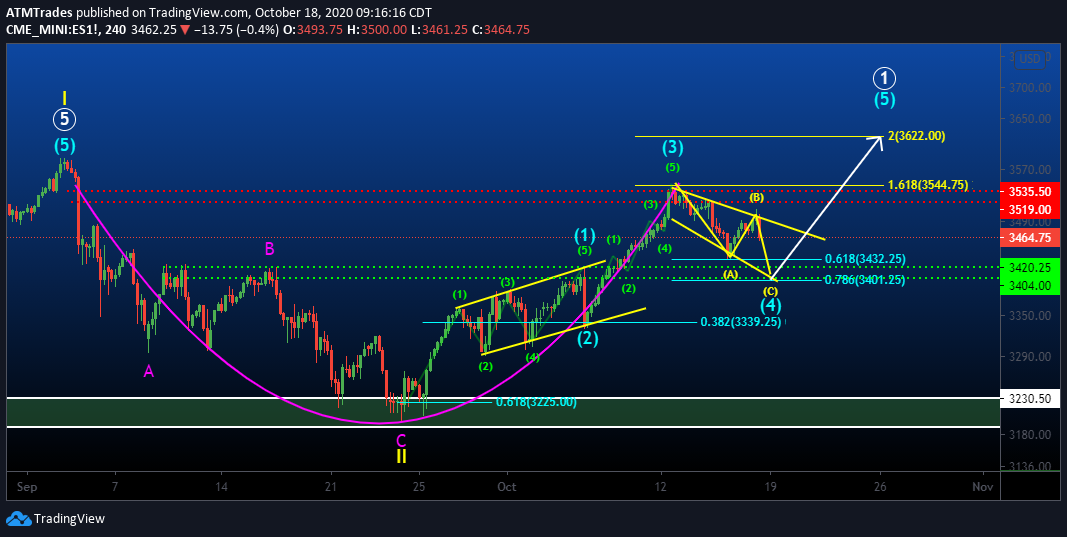
BA (1-day timeframe)
BA has finally broke out of its falling wedge pattern that took months to finish (June-October). What I’m expecting to happen is to see a breakout continuation after a retest of resistance (support on Friday of $167).
We now should be entering wave 3 of 3 (the strongest wave) after the 737 max approval. My projection is possibly $193 once this stock really gets moving and the momentum can be extremely aggressive too.
Breakout level: $171
Support Levels: $164, $167
Resistances to watch for: $171, $178.50, $184.55, $189.50, $193.55
This long idea invalidates on a close below $163.
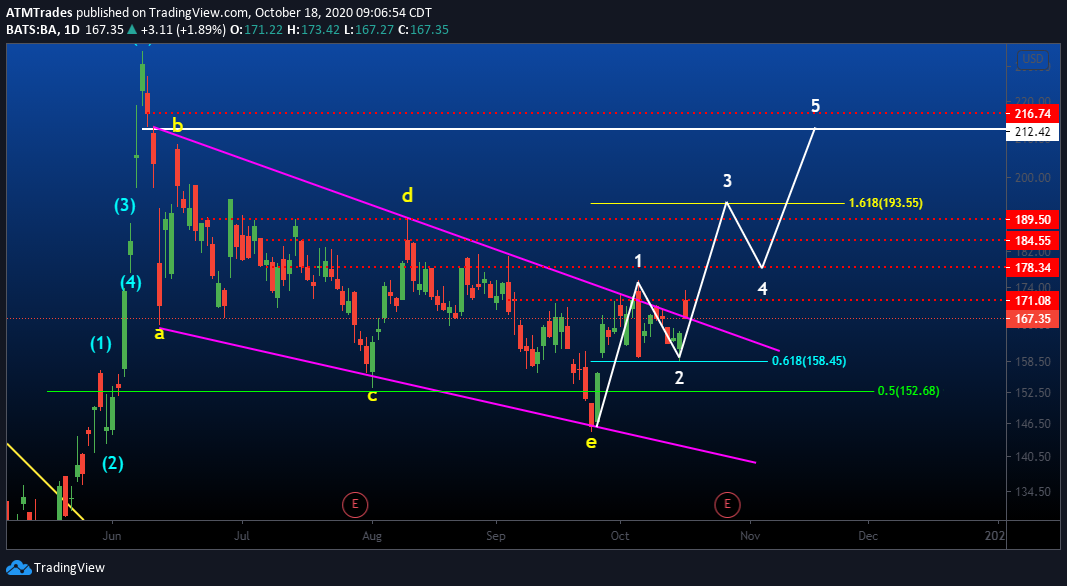
FB (2-hour timeframe)
Bull case: Watch for support to confirm at $263, and if that fails target the $257 level to buy before we push higher for ER.
Support to watch for: $257
Resistances to watch for: $267, $271, $277, $283, $290
Bull case invalidates on a close below $255.
Bear case invalidates on a strong breakout over $267.67.
ROKU (1-hour timeframe)
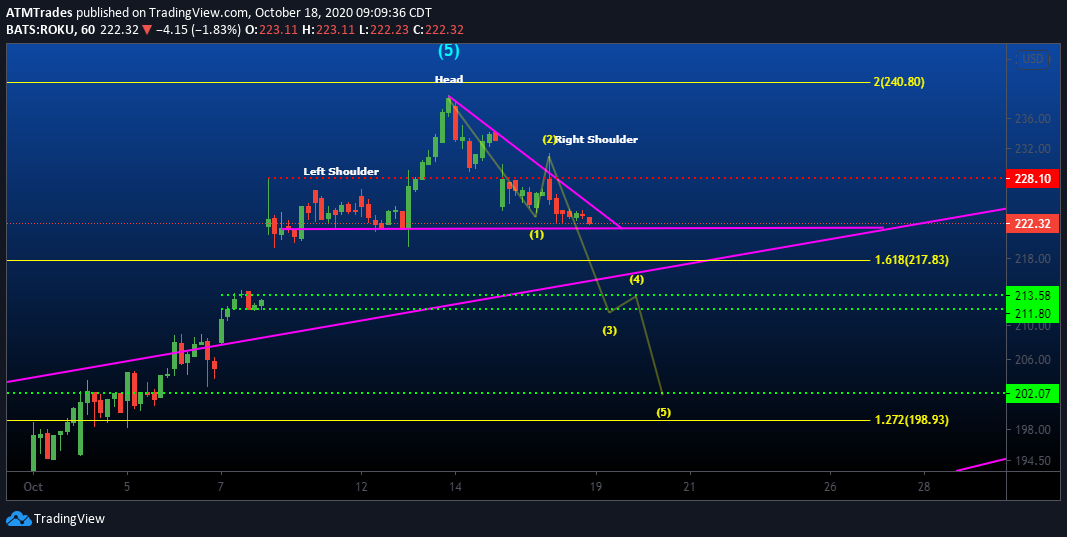
This short idea invalidates on a close above $228.10.
AAPL (2-hour timeframe)
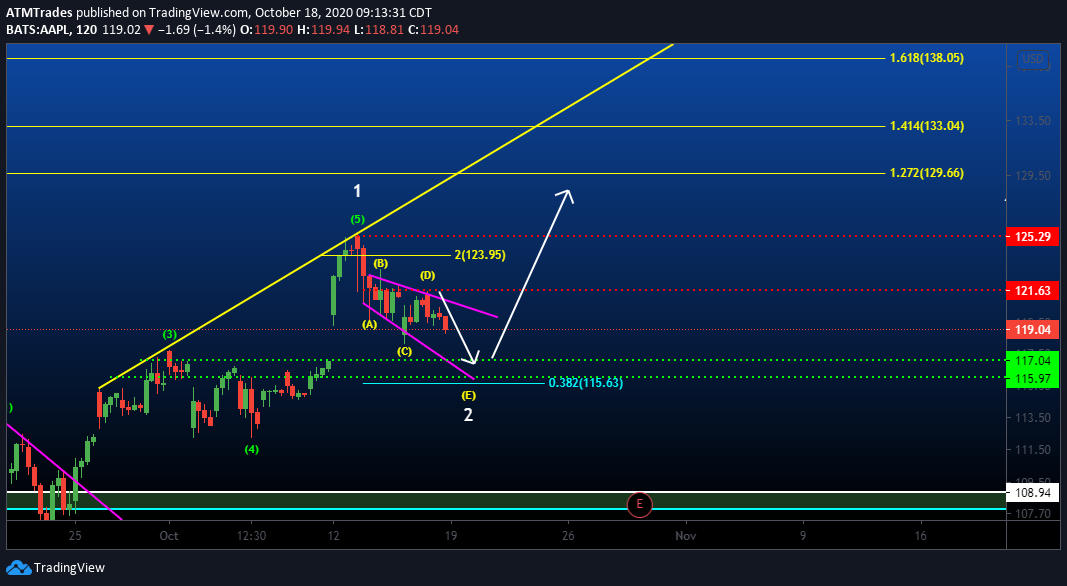
Much like the rest of the market, AAPL topped out at the beginning of the week on the hype from its iPhone release event. Now, I’ll be watching for AAPL to finish this expanding triangle correction down to the daily demand level before resuming higher for a push before earnings.
If you wish to play the bear side, you can short this down to the $117 level into the $115 level. The short invalidates on a close above $120. There is a higher risk to reward ratio on the bull side for AAPL if it can touch the $129.66 level.
Support to watch for: $115-$117 daily demand Zone
Resistance to watch for: $120, $121.63, $123.95, $125.29, $130
The long invalidates on a close below $113.75.
BABA (4-hour timeframe)
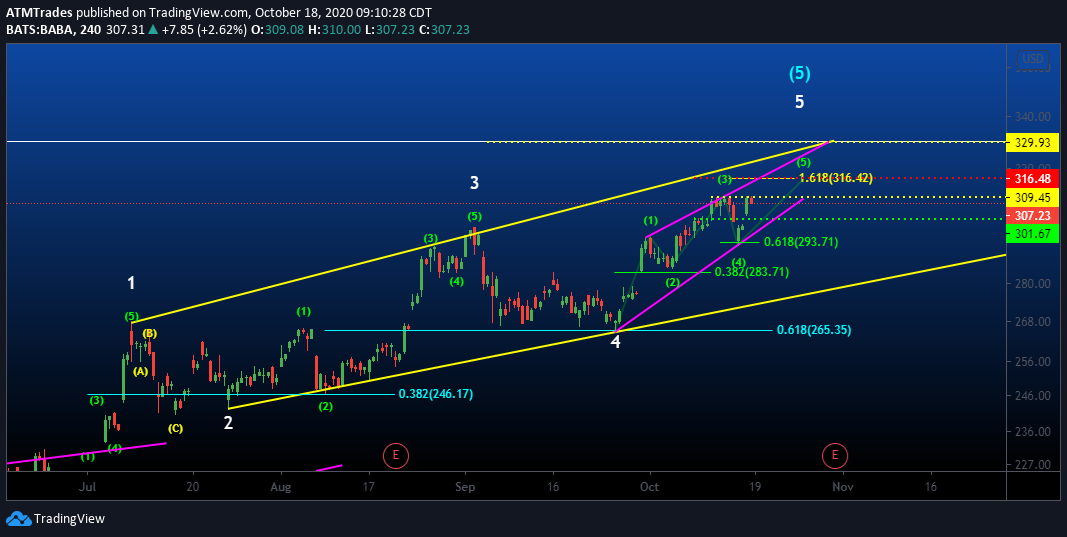
This will be the easiest play guide of the week.
All that needs to be done here is watching for a breakout over the $309-$310 supply zone. If we do get this desired breakout, look for Alibaba to make a potential parabolic move (parabolic = it flies like a rocket upwards)
Resistance to watch: $316.42, $320, $325, $330Breakout level: $310
DKNG (1-hour timeframe)
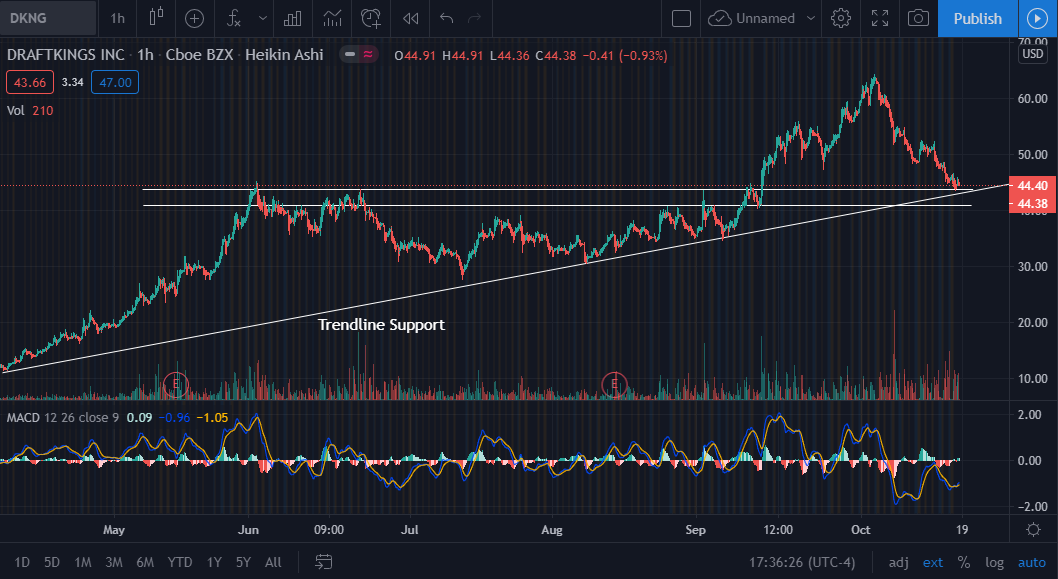
News:
Oct. 15 – Delay of 30 games that have had to be rescheduled this fall (bad)
Oct. 15 – New agreement with Turner Sports (good)
Oct. 12 – Upgrade by Credit Suisse/Needham (good)
Oct. 08 – Downgrade by Cohen (bad)
Oct. 05 – Company had a public offering to raise funds (bad)
Analysis: This story behind DKNG is more bullish overall by analysts, and I do expect it to hold trendline support unless further news about delaying of sports games. Currently, DKNG is at a key trendline support level here, meaning if this breaks through $43.50 then I would be short (puts) to $40. If DKNG is able to hold trendline support, then I would be long (calls) back to $48.30
SNAP (1-month timeframe)
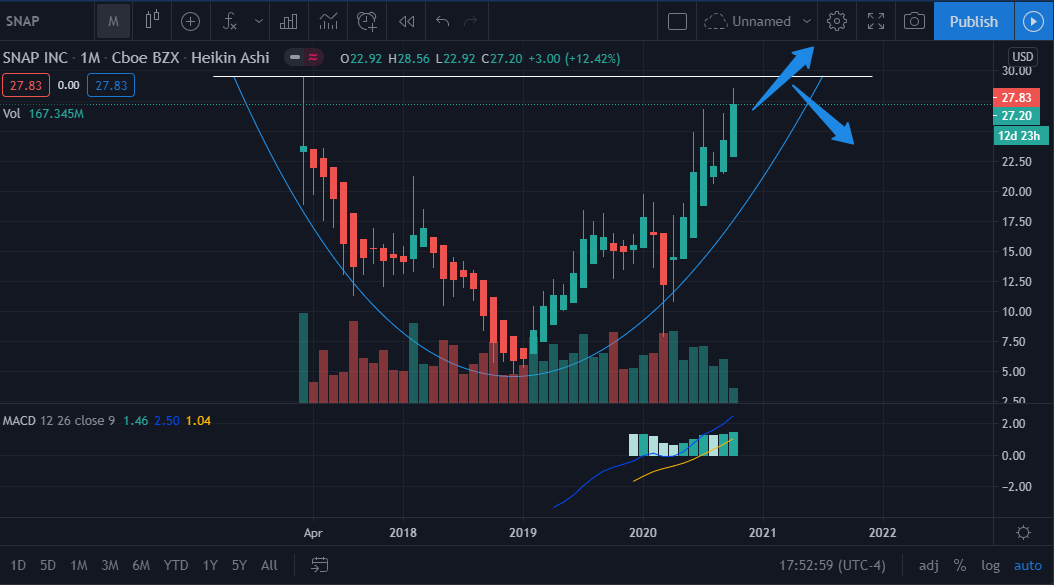
News:
Oct. 20th – Earnings report(After Hours).
Oct. 16th – Wedbush Upgrade.
Oct. 12th – Deutsche Bank Upgrade (reportedly sees ad recovery)
Oct. 8th – Cowen Upgrade
Sept. 28th – Guggenheim Upgrade
Analysis: SNAP has earnings approaching on Tuesday, so I’ll be watching to see the gap fill to resistance of the cup at $29.44. This will do 2 things: 1) form a handle likely caused by an earnings report or 2) break through the resistance of the cup and make new all-time-highs as it has potential to blow away earnings expectations as it is benefiting from the COVID-19 pandemic.
MSFT (15-minute timeframe)

In this Snapshot you can see a perfect 3 wave setup for a final push into earnings on the 27th of October.
Steps one and two are there and the chart is primed for a move up into earnings.
Next, let’s look at the options flow. On Friday, October 16th,a $18.1 million dollar call option block was purchased for the strike of $230 with an expiration of 12/18/2020. This shows a very aggressive move and bullish call going into earnings.
What I will be looking for this week is a bounce on Monday off of the red uptrend line to confirm Wave 3 (purple line). A break of the red uptrend line would void Wave 3, meaning we would not take a position. All moves in white are made using Fibonacci levels, which I removed to make the chart easier to read.
NFLX (15-minute timeframe)
I am also very interested in NFLX this week for an earnings run-up (they report Tuesday after market close). There was a one million dollar call order that came out on Friday, October 16th for a strike of $565 and expiration of 11/20/2020.
I am looking for a bounce Monday to confirm a bullish move into their earnings report. I could see a move Monday as anywhere from $538 to $548 is possible.
NFLX is currently sitting exactly at a perfect retracement level, which would also support the theory of a bounce on Monday.
Trade Reviews from Last Week
UBER update: Once UBER broke under $36.50, which was described as the key level for confirmation of a handle uptrend, the play was voided. That being said, watch it for a reversal off of the $33.55 area and a break above $34.20 to confirm a reversal.
IBM Update: IBM filled the gap and has held the key level of $124.50. I will be watching for a continued move above $127. I now believe IBM is halfway through forming a cup and will continue to watch the formation going forward.
– The Financial Cloud Team
Disclaimer: Investing involves substantial risk. Neither TFC, the publisher nor any of their respective affiliates make any guarantee or other promise as to any results that may be obtained from using the Newsletter. While past performance may be analyzed in the Newsletter, past performance should not be considered indicative of future performance. No reader should make any investment decision without first consulting his or her own personal financial advisor and conducting his or her own research and due diligence, including carefully reviewing the prospectus and other public filings of the issuer. To the maximum extent permitted by law, the Author, the publisher, and their respective affiliates disclaim any and all liability in the event any information, commentary, analysis, opinions, advice, and/or recommendations in the Reports prove to be inaccurate, incomplete or unreliable, or result in any investment or other losses.