Trading Newsletter – 10/25/2020
Quote of the Week
“An entire ocean can’t take down a ship, unless it gets inside the ship. The same goes for negativity. The negativity of the world can’t take you down, unless you allow it to get inside of you.”
– Anthony Evans
My, oh my…
Donald Trump apparently told his top donors it “will be hard to hold the Senate” in the upcoming November elections. Besides the 2020 Presidential Election, the Senate is probably the second most important race (or set of races) the GOP needs to win to stay “in power”. With the potential of a democratic president and a democratic Senate, all of the GOP-led bills that have passed in the recent years may be undone by the next administration.
At the same time, Treasury Secretary Mnuchin and Speaker of the House Pelosi continue to blame the other for the never-ending stimulus stalemate. It seems stimulus, which everyone is expecting to come soon, may never come. Earlier this month, Federal Reserve Chairman, Jerome Powell, stated that he believed the U.S. economy would need more fiscal stimulus if it were to have any chance of a meaningful rebound, adding to the consensus that stimulus is needed more than ever.
Major News
- As the Tuesday deadline for fiscal stimulus passed, all hope seems lost, and, as of right now, any substantial stimulus has low chances to pass both chambers of Congress. To be frank, it’s the normal shenanigans of Congress: Democrats want more, Republicans want less… so here we are, running around in circles once again.
- Earnings season has begun, and, so far, most of the companies have actually outperformed their earnings estimates. To no surprise, most e-commerce and technology sites continue to perform well which begs the question, “Are we at the beginning of another major bull market?”.
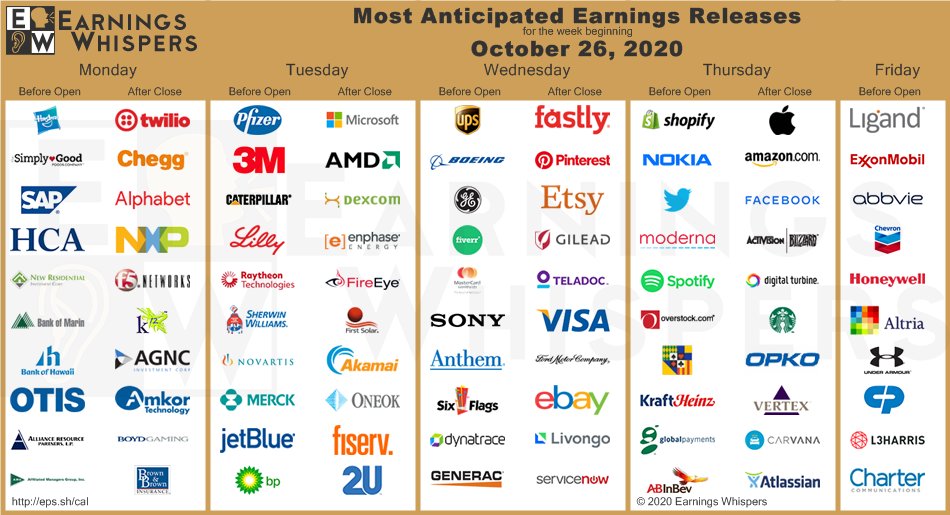
*See below for full calendar Presented by Earnings Whispers (check them out here)
Upcoming Economic Events

It’s the biggest week of the quarter in terms of economic data. GDP (gross domestic product) is single-handedly the biggest piece of economic data that can give economists and traders insights into how the U.S. economy faired during the previous quarter. The forecast is a whopping 31.9%, which, if is anywhere near on-target, will be one of, if not, the greatest percentage change in GDP the U.S. has ever seen.
Now, before you go tell your father this awesome fact you saw on the internet, I need to remind you that the economy will still be below pandemic levels. But you may ask, “how?”. Let’s do some simple, yet overlooked, math.
Example: If the U.S. economy was producing say $20 billion in yearly economic productivity, and lost 31.4% (seen above under the previous column) of its productivity, that would put us at roughly $13.72 billion in output [(1-0.314)*($20 billion) = $13.72 billion]. Now take that $13.72 billion and multiply it by the new forecast of 31.9% and we get approximately $18.1 billion in output [($13.72 billion * (1 * 0.319))] which is nowhere near the original $20 billion in output.
Long story short: we’re not out of the weeds yet.
On watch for next week:
Third quarter (July through September) GDP data will be released this Thursday at 8:30 EST. This is one of the few economic indicators that can have a massive impact on markets across the globe, as GDP tells us how productive society has been over the past three months. The trading day can be determined solely by this piece of information (bullish or bearish), so be careful if we either beat big or miss big.
Charts, Charts, & More Charts
Color codes are as follows:
Avery (ATM) = Blue
Haseeb (Airdrake) = Green
Tom (Tomikazi) = Red
These charts are intended to help you to become a better trader, so don’t take every trade seen and expect to make money. Do you own due diligence and research before investing and/or trading.
FSLY (daily timeframe)
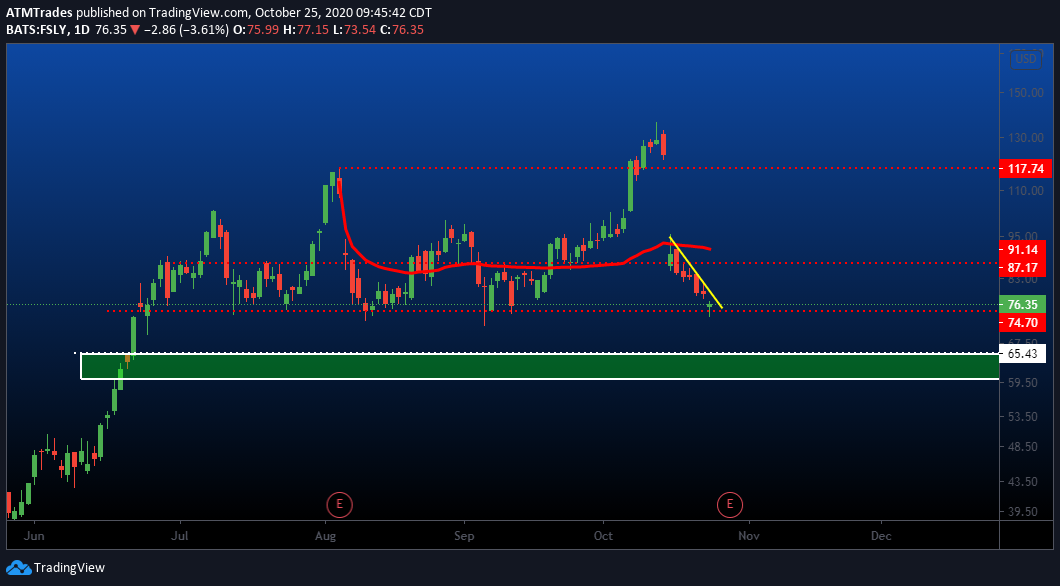
This week on FSLY, we will be looking to play the short side. The daily candle rejected the anchored VWAP support on the 15th and failed to reclaim it on the long side, as buyers have yet to show. Now that the downtrend has shown to be dominant, we will need to watch for a break of the $74.50 level to confirm more downside towards the $65 support level.
Supports to watch for: $74.50, $70, $65
Breakdown level: $74.50
Breakdown confirmation level: $70
Resistances to watch for: $80
This short invalidates on close above $80
TWTR (1-month and 1-hour timeframes)
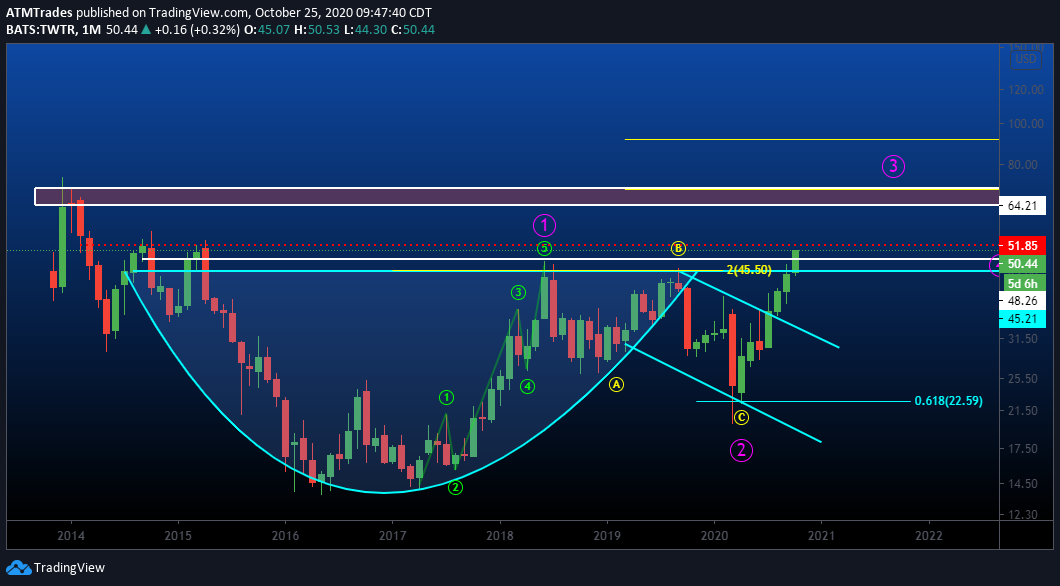
FB’s earnings release is fast-approaching, so we will be watching TWTR as a sympathy play. After SNAP reported better-than-expected earnings, I do expect ad revenue-driven companies to continue to climb higher.
On the monthly chart, we have a clear cup and handle on the verge of a breakout.
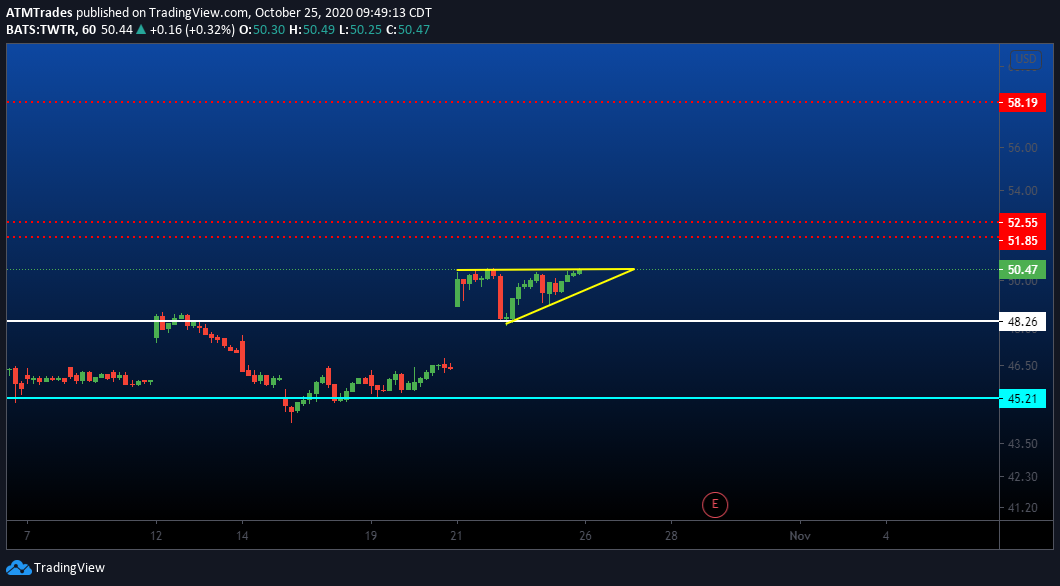
On the hourly there’s a clear ascending triangle ready to break out as well.
For this week’s levels, we need to watch the $51.85 – $52.55 supply zone. Once we can close over that supply level, TWTR will begin a macro breakout where there is little resistance until the $60 level.
Resistance to watch for: $52.50, $55, $60
Breakout level: $52.50
Breakout confirmation level: $55
This long invalidates on a close below $48.
**Might I note this is also great play if you are interested in LEAPs as premiums are cheap and the uptrend is clear.
BABA (4-hour timeframe)
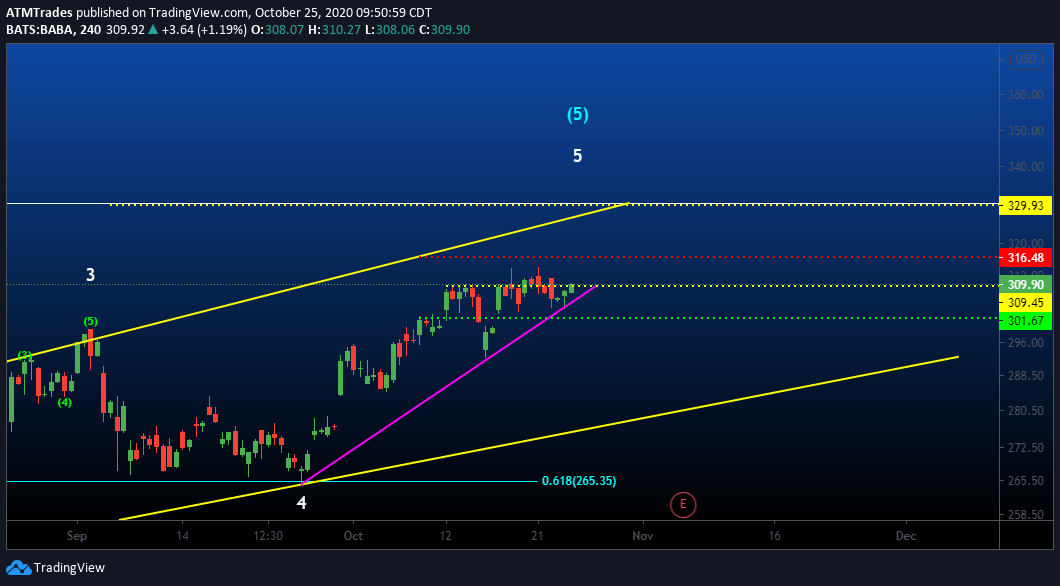
I’ll be bringing BABA back to the table again this week as we’re getting hints of a breakout (they all failed to confirm last week). What we’re watching for is a breakout over the $309-$310 supply zone.
Alibaba tested this zone multiple times proving that the resistance is weak and will only take one day to confirm the potential of a multi-day runner. If we do get this desired breakout, I would like to see a solid uptrend the day it breaks higher. Once we do get our confirmation of the breakout over $310, BABA should continue to push higher as it will follow Amazon (which has ER towards the end of the week).
Support to watch for: $306.50
Breakout level: $310
Breakout confirmation level: $314
Resistance levels to watch for: $311.50, $314, $316.42, $320, $325, $330
This long idea invalidates on a close below $305
FB (1-hour timeframe)
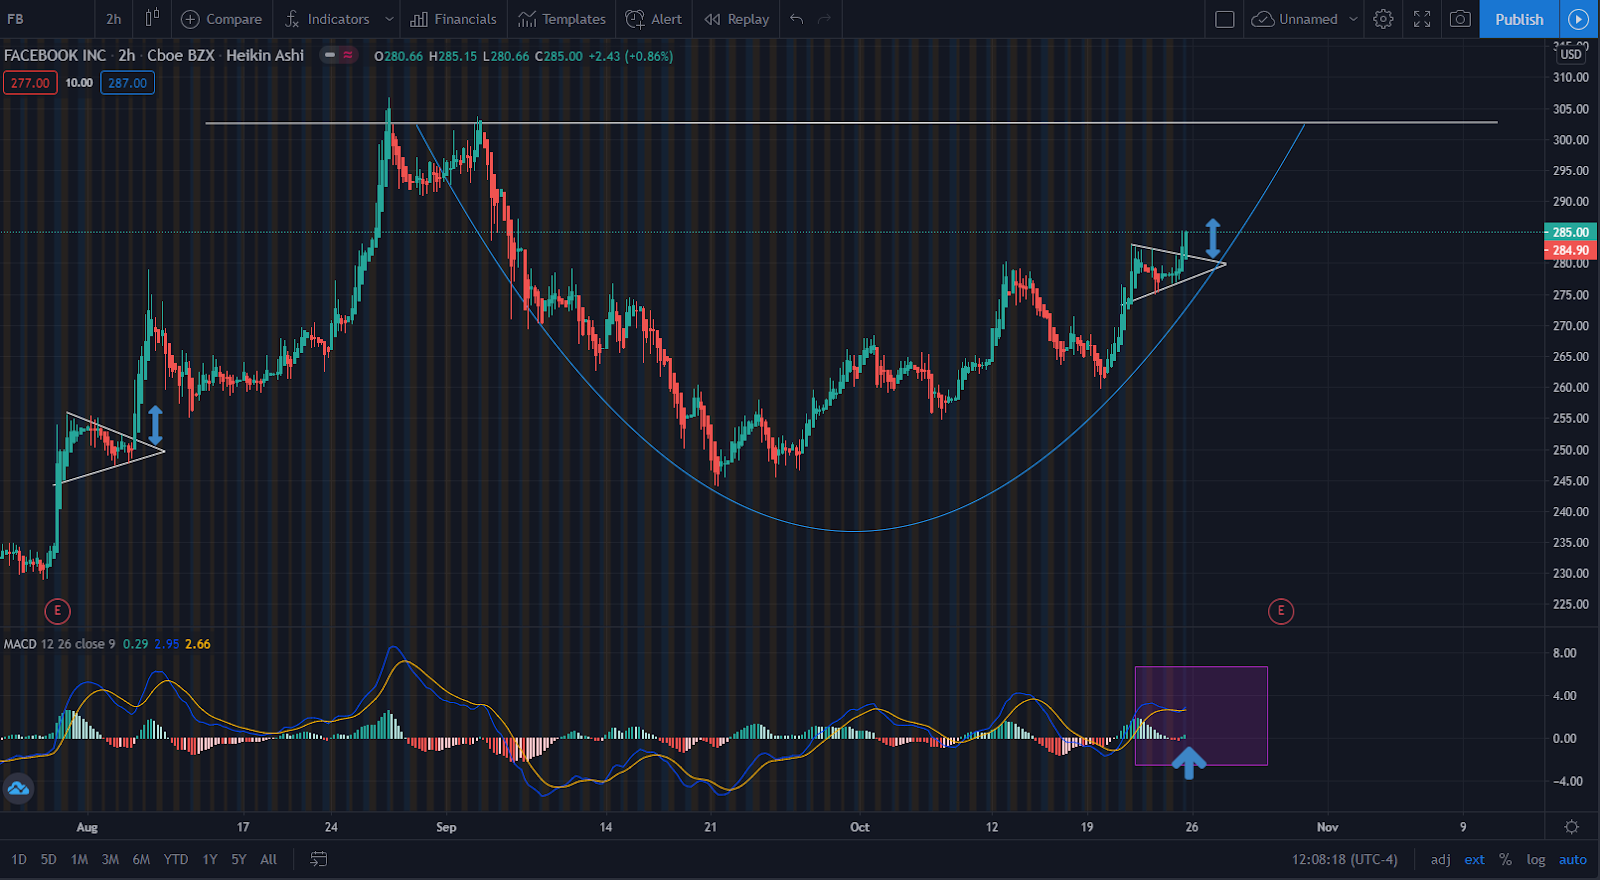
News:
10/22 – Monetized WhatsApp via shopping, cloud services
10/22 – Launched dating service in 32 European Countries
10/20 – Jefferies upgraded price target from $310 to $320 (20% upside)
10/08 – Cowen upgraded price target from $290 to $320 (22% upside)
Analysis: On the 1-hour chart, we saw the initial breakout of a bull pennant with some continuation expected into earnings on 10/29 (after hours). On the 2-hour chart, we can identify the larger pattern of a cup & handle pattern (identical to SNAP; image below for reference). We don’t normally get second-chance opportunities at a stock in the same sector with the same catalyst potentially sending that stock soaring. A moderate target is $300 with some upside to breaking the all-time-high of $306.68.
Please do me a favor and don’t dump all of your money into one play after what you missed on SNAP. There will be more opportunities, so don’t let one trade tarnish your portfolio.
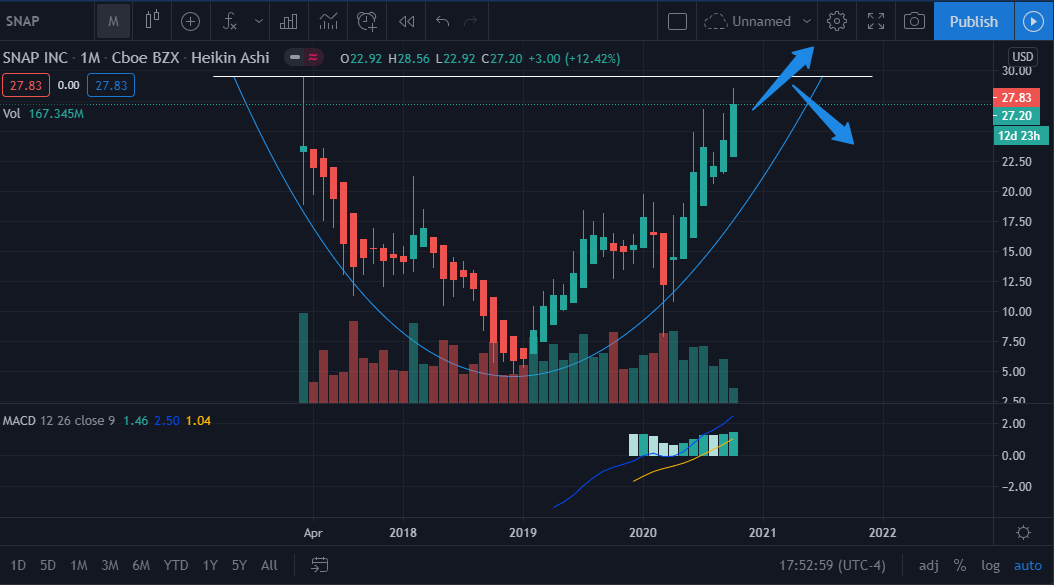
**SNAP chart above for reference
SQ (2-hour timeframe)
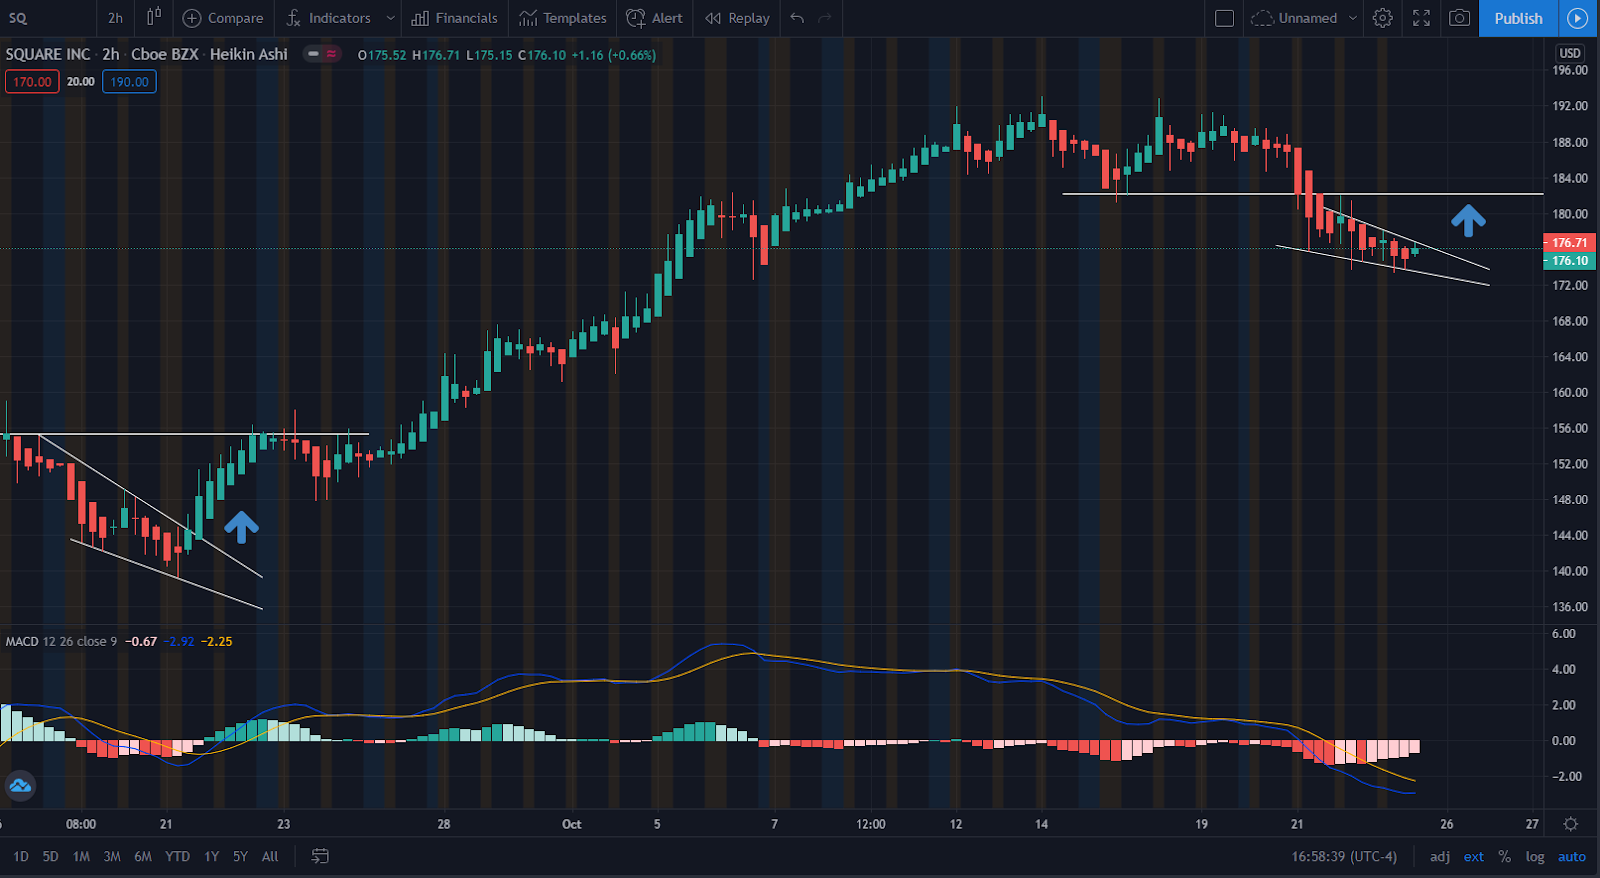
News:\
10/21 – PayPal launched crypto service in competition to SQ
10/21 – Visa launched digital payments in competition to SQ
10/08 – Purchase of $50million in Bitcoin
09/29 – Wolfe upgraded price target from $160 to $195
Analysis: Competition dragged SQ down recently, although the company owns majority of newer digital payment services. It is surging as a result from buying Bitcoin (the first ever from a major, publicly-traded company). Shown above is a falling wedge on SQ. You can see the previous falling wedge that confirms the uptrend that is coming soon. Look for the break of resistance on this falling wedge, which is over $182. I expect to continue the uptrend this week.
Now, with the earnings report scheduled for 11/4 (after hours), this should run up into the earnings in which SQ will need to prove that it has earned its way to its current valuation and raise guidance.
Key levels to watch – $182 / $185.18 / $187.30
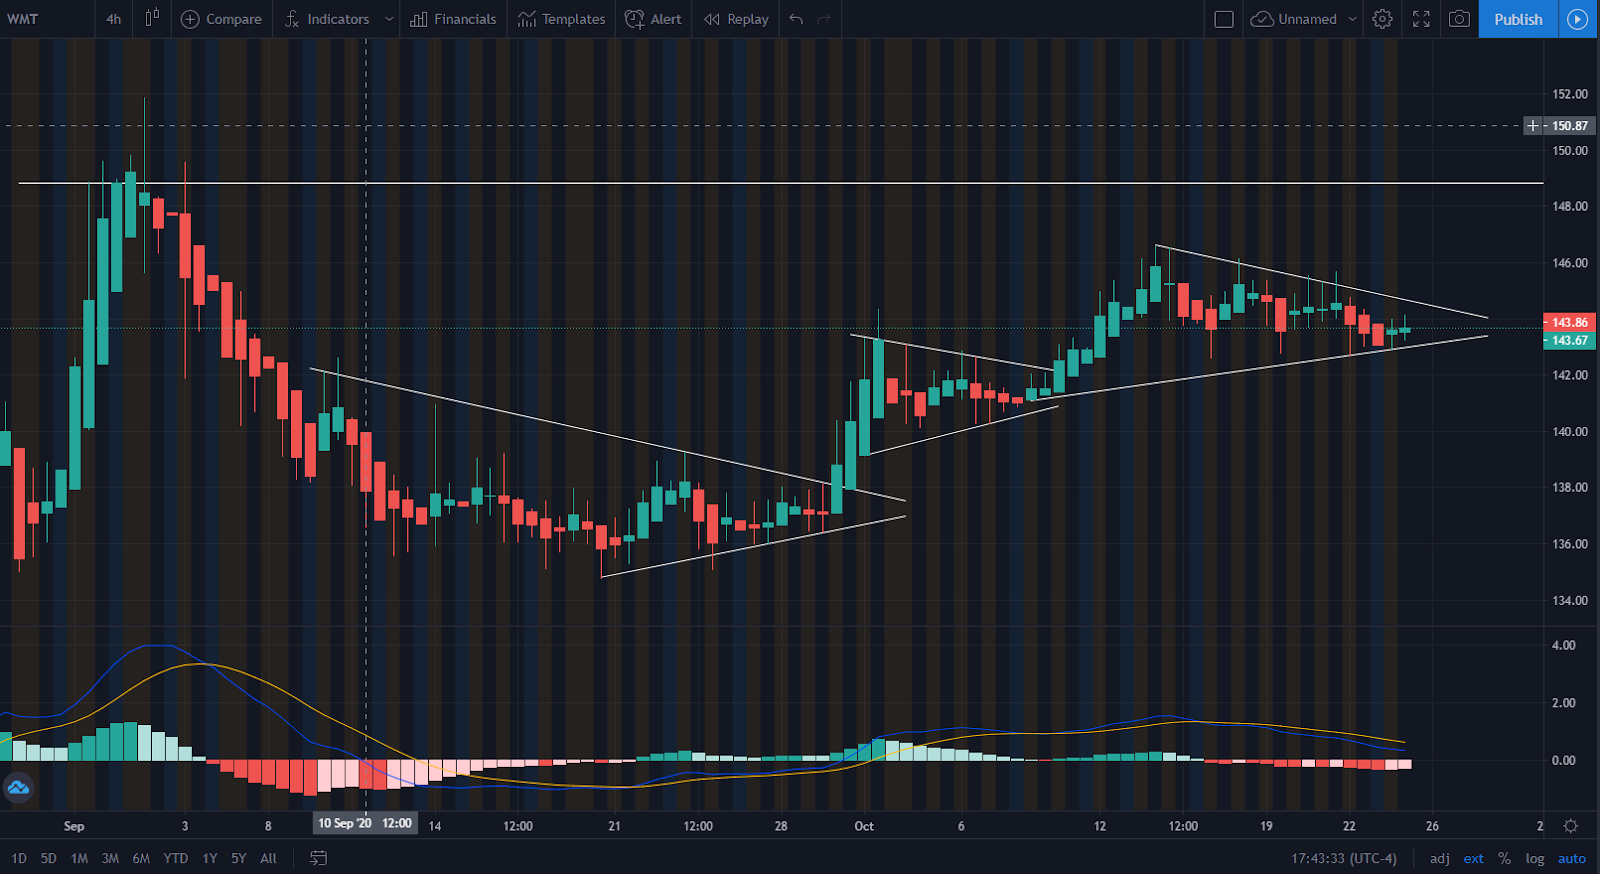
WMT (4-hour timeframe)
News:
10/24 – Bank of America names WMT as a top 10 US stock pick for 4Q2020
10/16 – Jefferies upgraded with price target of $165 (upside as much as $180)
10/14 – Black Friday is reported to be a month-long event in November
10/09 – WMT hired 10,000 employees in Canada
Analysis: Count the wedges as WMT builds it’s staircase upward. The next target for WMT is around the $149 range on breakout of this wedge. Look for break of resistance for the entry point.
SNAP (15-minute timeframe)

Snapchat had some of the most aggressive call flow going into the weekend, which supports a third wave up into next week. Towards the close of Friday, October 23rd, I noticed a $1.1 million order that expires in three weeks. It was with a strike of $42.50 and was an opening order (bullish sentiment).
I decided to go a simpler route this week with my charts, hopefully they are easier to understand.
In this 15-minute candle view, we can see a clearly-defined channel up and waves one and two of a three wave up. Using Fibonacci extension and time wave tools we can try to estimate the length and height of wave three. Wave three has a target area of $46 to $46.50, with a potential extended target of $49.50 under heavy volume.
I have color-coded what I would consider confirmation and abandonment lines. A full candle break below either red channel line would be considered an abandonment line or an invalidation of wave three. A break above the green horizontal line would be the completion of a full Fibonacci movement and confirm an extended move up towards the $46-$49 area.
One thing to always keep in mind with extreme runs like this is questioning whether there is enough fuel left to extend the run before a pullback and profit taking. Personally, I believe there is. Looking at the most recently updated short data (stock on loan that needs to be repurchased), I believe we are seeing the final leg of a short squeeze (shares forced to be repurchased due to a margin call). As of Wednesday, October 20th, when short data was released to the public, SNAP still had 62,800,000 shares on loan. This represents 7% of all available shares to the public and an average short ratio (days to cover based on average volume) of three days. While I do believe a lot of this has already happened, I also believe we still have an additional one to three days left of shorts covering their positions.
TWTR (15-minute timeframe)
Twitter is set to report Earnings on 10/29/2020 after the market closes. I believe we are primed for an earnings run-up.
Twitter has ton going for it right now. Like SNAP, Twitter could also be finishing up a short squeeze but to a lesser degree with a smaller short ratio. What Twitter does have going for it is bullish sentiment going into earnings next week. This is backed by extremely aggressive call buying all week.
On the chart we see a well-defined up channel, with a few breaks above and below. I believe we are primed for another break above the channel with a possible move towards the $54 range completing wave three and Fibonacci extension. A slight pullback the day of earnings would also make sense for a small wave four. Wave five is still up in the air based on earnings, but good earnings could certainly propel TWTR towards the $56-$57 range.
Watchlist for the Upcoming Week
EBAY, UPS, V, PINS, MSFT, PFE, AMD, V, FSLY, AAPL, FB, ATVI, & ABBV
– The Financial Cloud Team
Disclaimer: Investing involves substantial risk. Neither TFC, the publisher nor any of their respective affiliates make any guarantee or other promise as to any results that may be obtained from using the Newsletter. While past performance may be analyzed in the Newsletter, past performance should not be considered indicative of future performance. No reader should make any investment decision without first consulting his or her own personal financial advisor and conducting his or her own research and due diligence, including carefully reviewing the prospectus and other public filings of the issuer. To the maximum extent permitted by law, the Author, the publisher, and their respective affiliates disclaim any and all liability in the event any information, commentary, analysis, opinions, advice, and/or recommendations in the Reports prove to be inaccurate, incomplete or unreliable, or result in any investment or other losses.