In mathematics, the Fibonacci numbers commonly form a sequence called the Fibonacci sequence. In a Fibonacci sequence, you will see that each number is the sum of the two preceding ones, starting from 0 and 1.
Math sucks, so let’s not focus on that. I simply wanted to give you the official definition for clarity. Now what’s excellent about today’s software is that we don’t have to do the math to calculate these ratios, as they will do it for us. Fibs can be used in various situations, and for me, my favorite cases are for retracements, breakout targets, and ATH (All Time High) resistances due to the lack of true supply above.
Now there are certain fibs that hold far more significance than others but all ratios still act as a support/resistance in one way or another.
The key fibs to note are: 0%, 23.6%, 38.2%, 61.8% (The golden Ratio), 78.6%, 100%, 121%/141% (some-times), 161%, 200%, 261%, 300%, 361% 400%, and 461%.
That’s a ton of numbers I just told you to memorize… I know, so we are going to break it down here on levels of importance in each given situation and why.
For short-term Bear situations, the most important fibs to note after failing to continue higher on the bullish move are 23.6% and 38.2%. (Typically, a bull flag is created if support is found in this range)
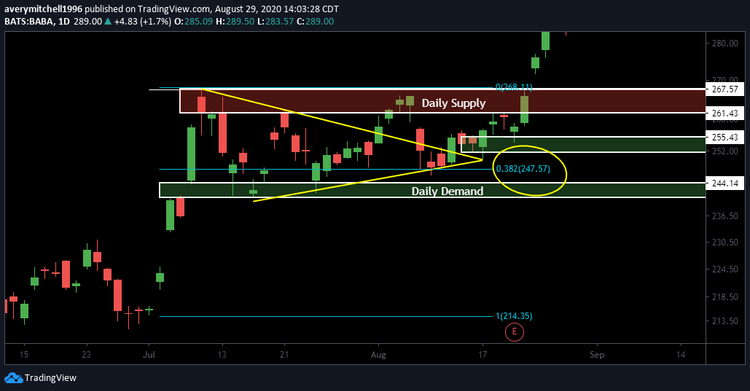
Again we are using the BABA daily chart for this example. For the fibs here, we measured the entire bullish move from 214 to 267. Now after locking our fibs in, we see that there is a strong confluence with the fibs, ascending bull flag support, and the demand zone. Also, note how the 38.2% retrace zone was broken, but thanks to our demand zone, we know that this support will be reclaimed. After testing it multiple times, fib support was confirmed on august 12th, right before the bull flag breakout, where we then saw continuation higher to all-time highs.
The other two retrace zones are 61.8% and 78.6%(Typically a fast and steep correction followed by a falling wedge or bull flag pattern). You will later understand how these show strong confluence with Elliot Wave projected supports as you finish the last section of the course.
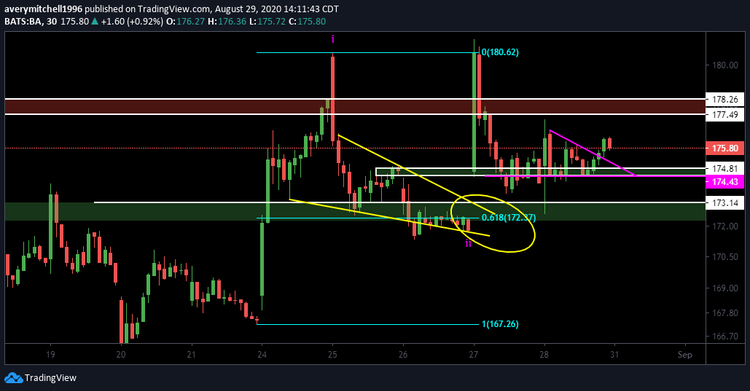
For this example, we are using the BA 30m chart. (30-minute chart… I know its a weird time frame, but this is for candle clarity) After the falling wedge was broken on a larger time frame, Ba proceeded to break out from 167 to 180. After we hit 180, we saw a steep, aggressive correction that then created a falling wedge from the 176 zones starting on August 25th. After measuring the full breakout from 167-180, what’s important here is the steep correction that followed immediately, hinting that we will see a 61-78% retrace here. The 61.8% retrace noted by the yellow circle “conveniently”(This is common) aligns with our demand zone There is also confluence here with falling wedge support as well. Typically we would see a bounce back into this demand zone off the wedge support but note this wedge ended up not completing fully due to news causing the breakout. (I mentioned in the first section that, at times, these patterns won’t complete due to outside variables like news, market sentiment, etc…)
For Bull breakout situations, the most important fibs to note after breaking the 100% line (recent high) are 121%,141%, 161%, 200%, and in some cases, 261% or greater. Again you will understand how these show strong confluence with Elliot Wave projected resistances on breakout moves.
The 200%, 261%, 300%, 361%, 400%, and 461% will be the least used Fibs as they are on the extreme side of extended measurements of the current move. Why I say, these are important to note for obvious reasons. The x00% numbers are a 100% extension of the previous move high. (A major psychological number and the market loves whole numbers)
The x61% Fib is a 100% extension of the previous golden ratio. (Again, a major psychological number)
If you’re curious to know what the “Golden Ratio” is, continue reading this next paragraph. If not, Continue on to the paragraph thereafter.
In the Fibonacci sequence of numbers, after 0 and 1, each number is the sum of the two prior numbers. Hence, the sequence is as follows: 0, 1, 1, 2, 3, 5, 8, 13, 21, 34, 55, 89, 144, 233, 377, 610 and so on, extending to infinity. Each number is approximately 1.618 times greater than the preceding number. This value: of 1.618 is called Phi or the “Golden Ratio.” The Golden Ratio mysteriously appears frequently in the natural world, architecture, fine art, and biology. For example, the ratio has been observed in the Parthenon, in Leonardo da Vinci’s painting the Mona Lisa, sunflowers, rose petals, mollusk shells, tree branches, human faces, ancient Greek vases, and even the spiral galaxies of outer space.
How to Set Your Fibonacci Ratios
The “Fib retracement” tool will be your weapon of choice for finding Fib supports on a correction.
23.6%, 38.2%, 50%(Used less frequently) 61.8%, 78.6% will be the important levels to have set.
The next step you need to take your fib tool and measure the most recent move the ticker you are watching made and set your 0% level at the high of the move and your 100% level at the low.
Example A – Zoom 4HR
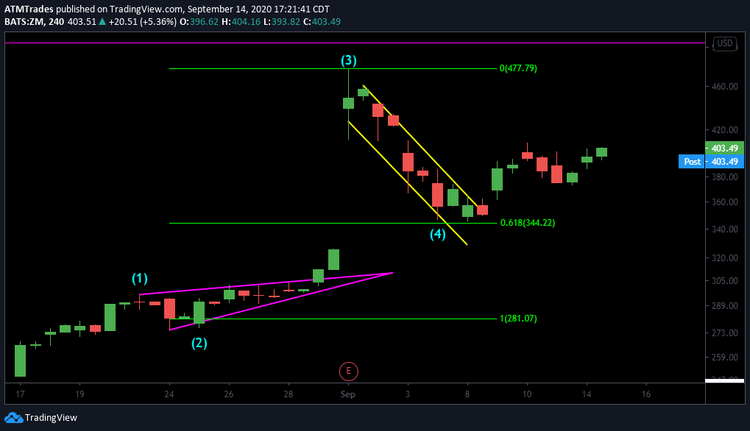
Here on Zoom’s 4HR chart, you are looking at a blowout ER(Earnings Report) move from 300-477 (An absolutely ridiculous move, might I add.)
Now to project how far Zoom should retrace, I took a few factors into consideration.
1) The gap below that needed to be filled
2) Wave 2 was a flat correction meaning that wave 4 should be a steep correction
3) profit taking should be 100% happen after a move as strong as this one overnight.
Knowing these factors, I chose the 61.8% retrace level as my target. To set this level, I place the 100% retrace mark at the start of the bullish move on July 25th and set the 0% retrace level at the opening high the next day.
As you can see, ZM created a falling wedge almost down to the penny of the 61.8% retrace level before reversing out of the trend resistance and running $60+ after almost a perfect touch of this support level.
Example B
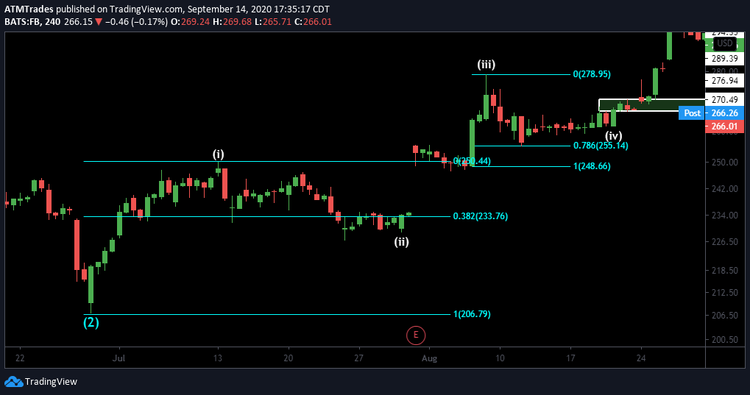
This is Facebook’s 4HR chart. There are a couple of examples found within this screen capture.
First off, note how waves 1-2(White roman Numerals) made a 38.2% retrace, which is typically an uncommon move as we tend to see a steep correction off of wave 1 highs.
The way this level was found was by placing the 100% retrace at the 206 low found at the end of July, then placing the 0% retrace level at the most recent high made off of this low.
Now since this is the first wave, I typically set all 4 major fib levels mentioned early as possible support zones until one proves to be the strongest level to buy off of. On this back-test, you can see that support was found at the 38.2% level before a strong move off of a nice Earnings Report. Likely this level was held due to earnings being so close, so buyers and sellers were in agreement on price level anticipating the big off move off the report.
After the ER, Facebook created a high and tight bull flag right above what was old resistance at the 0% retrace level before blasting off for new highs.
Once this high was made for wave 3, a strong pullback was surely coming for a few reasons:
1) profit-taking off a nice ER move
2) law of alternation states that if wave 2 is a flat correction, wave 4 must be a steep and fast correction.
With these two things in mind, I once again measured the most recent move from top to bottom and set my 61.8% and 78.6% fibs as possible support levels to catch.
As you can see, once FB met the 78.6% retrace, it proceeded to reverse higher and continue to make a move to new All Time highs shortly after.